Features • How To Use • Install • Visualizations • Data Source • Credits • To-Do List
Covidify downloads the latest covid-19 data for confirmed cases, deaths and recoveries.
- Creates a time series dataset
- Creates a daily stats dataset
- Forecast global and country confirmed cases
- Generate visualizations
- Filter by country
- List all countries affected
- Shows number of people currently infected
- Generates an excel report including all of the above
pip install covidify
$ covidify
Usage: covidify [OPTIONS] COMMAND [ARGS]...

  ☣  COVIDIFY ☣

   - use the most up-to-date data to generate reports of
     confirmed cases, fatalities and recoveries.

Options:
  --help  Show this message and exit.

Commands:
  list  List all the countries that have confirmed cases.
  run   Generate reports for global cases or refine by country.
$ covidify run --help
Usage: covidify run [OPTIONS]
Options:
--output TEXT Folder to output data and reports [Default:
/Users/award40/Desktop/covidify-output/]
--source TEXT There are two datasources to choose from, Johns Hopkins
github repo or wikipedia -- options are JHU or wiki
respectively [Default: JHU]
--country TEXT Filter reports by a country
--top TEXT Top N infected countries for log plot. [Default: 10]
--forecast TEXT Number of days to forecast cumulative cases in the future.
[Default: 15]
--help Show this message and exit.Example Commands:
# List all countries affected
covidify list --countries
# Will default to desktop folder for output and github for datasource
covidify run # Specify output folder and source
covidify run --output=<PATH TO DESIRED OUTPUT FOLDER># Filter reports by country
covidify run --country="South Korea"# Show top 20 infected countries on a logarithmic scale
covidify run --top=20# Forecast cumulative cases in America for 14 days into the future
covidify run --country=America --forecast=14An excel spreadsheet is generated with a number of visualizations and statistics.
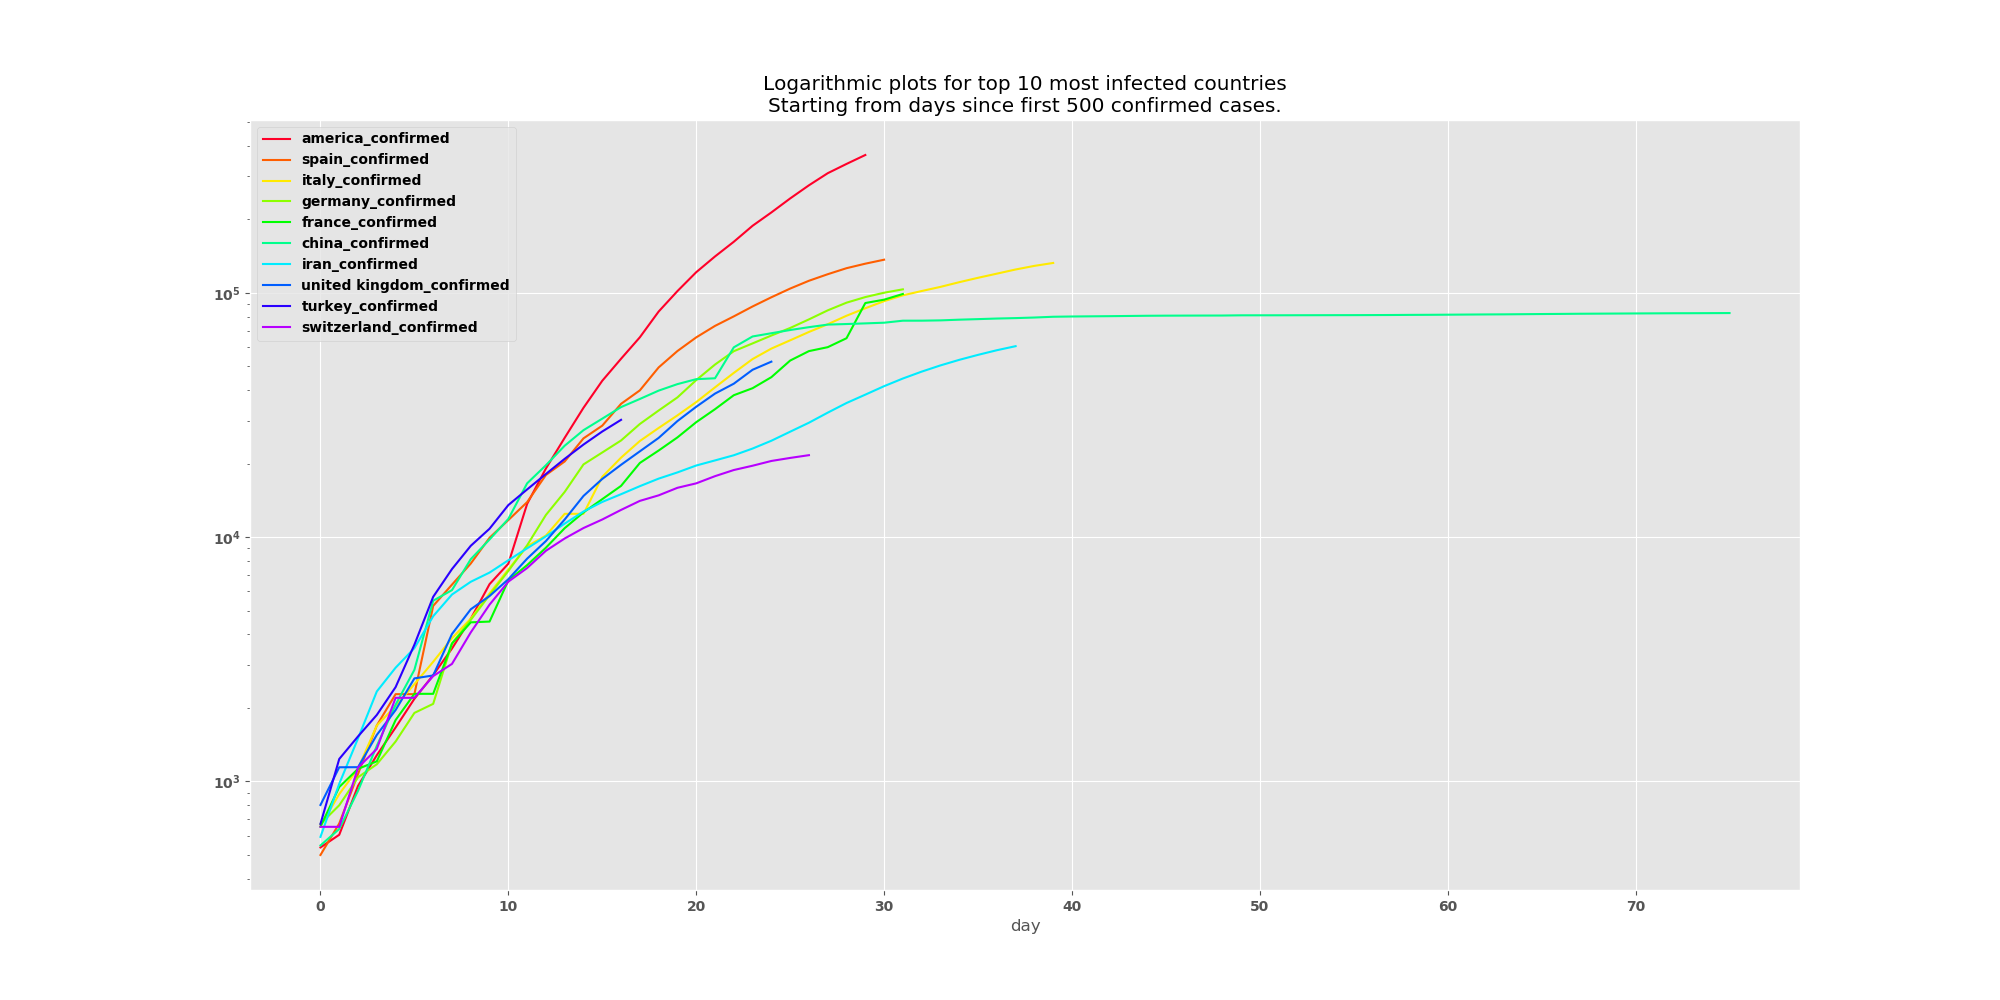
This plot shows the top N infected countries on a logarithmic scale.
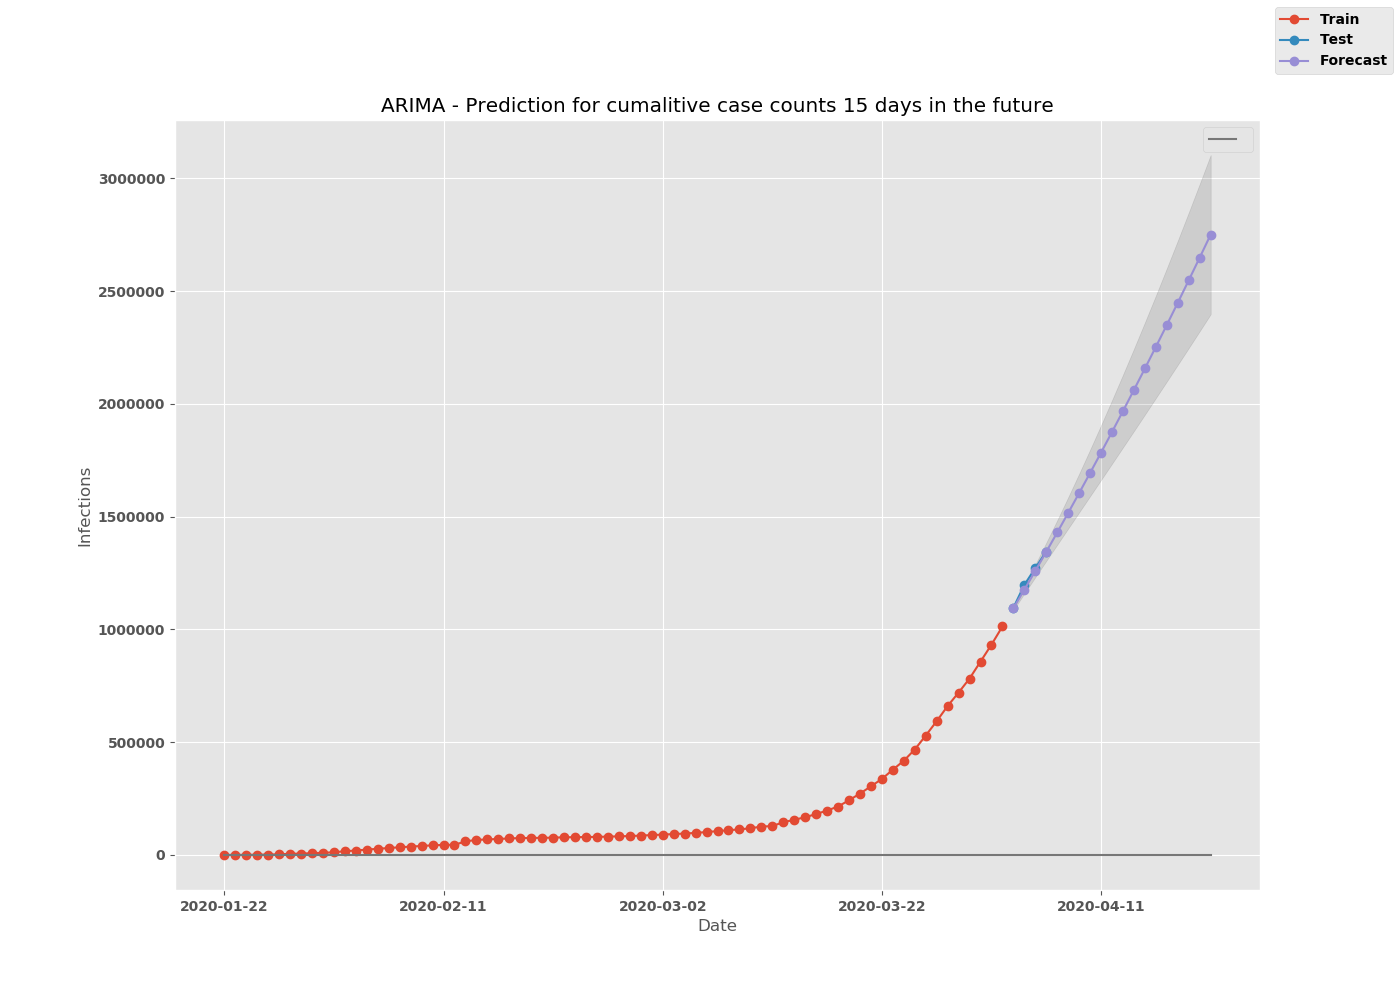
An ARIMA model is trained and used to forecast the cumulative cases for N number of days
into the future (DISCLAIMER: the forecast is a ballpark figure, and should not be taken as gospel)
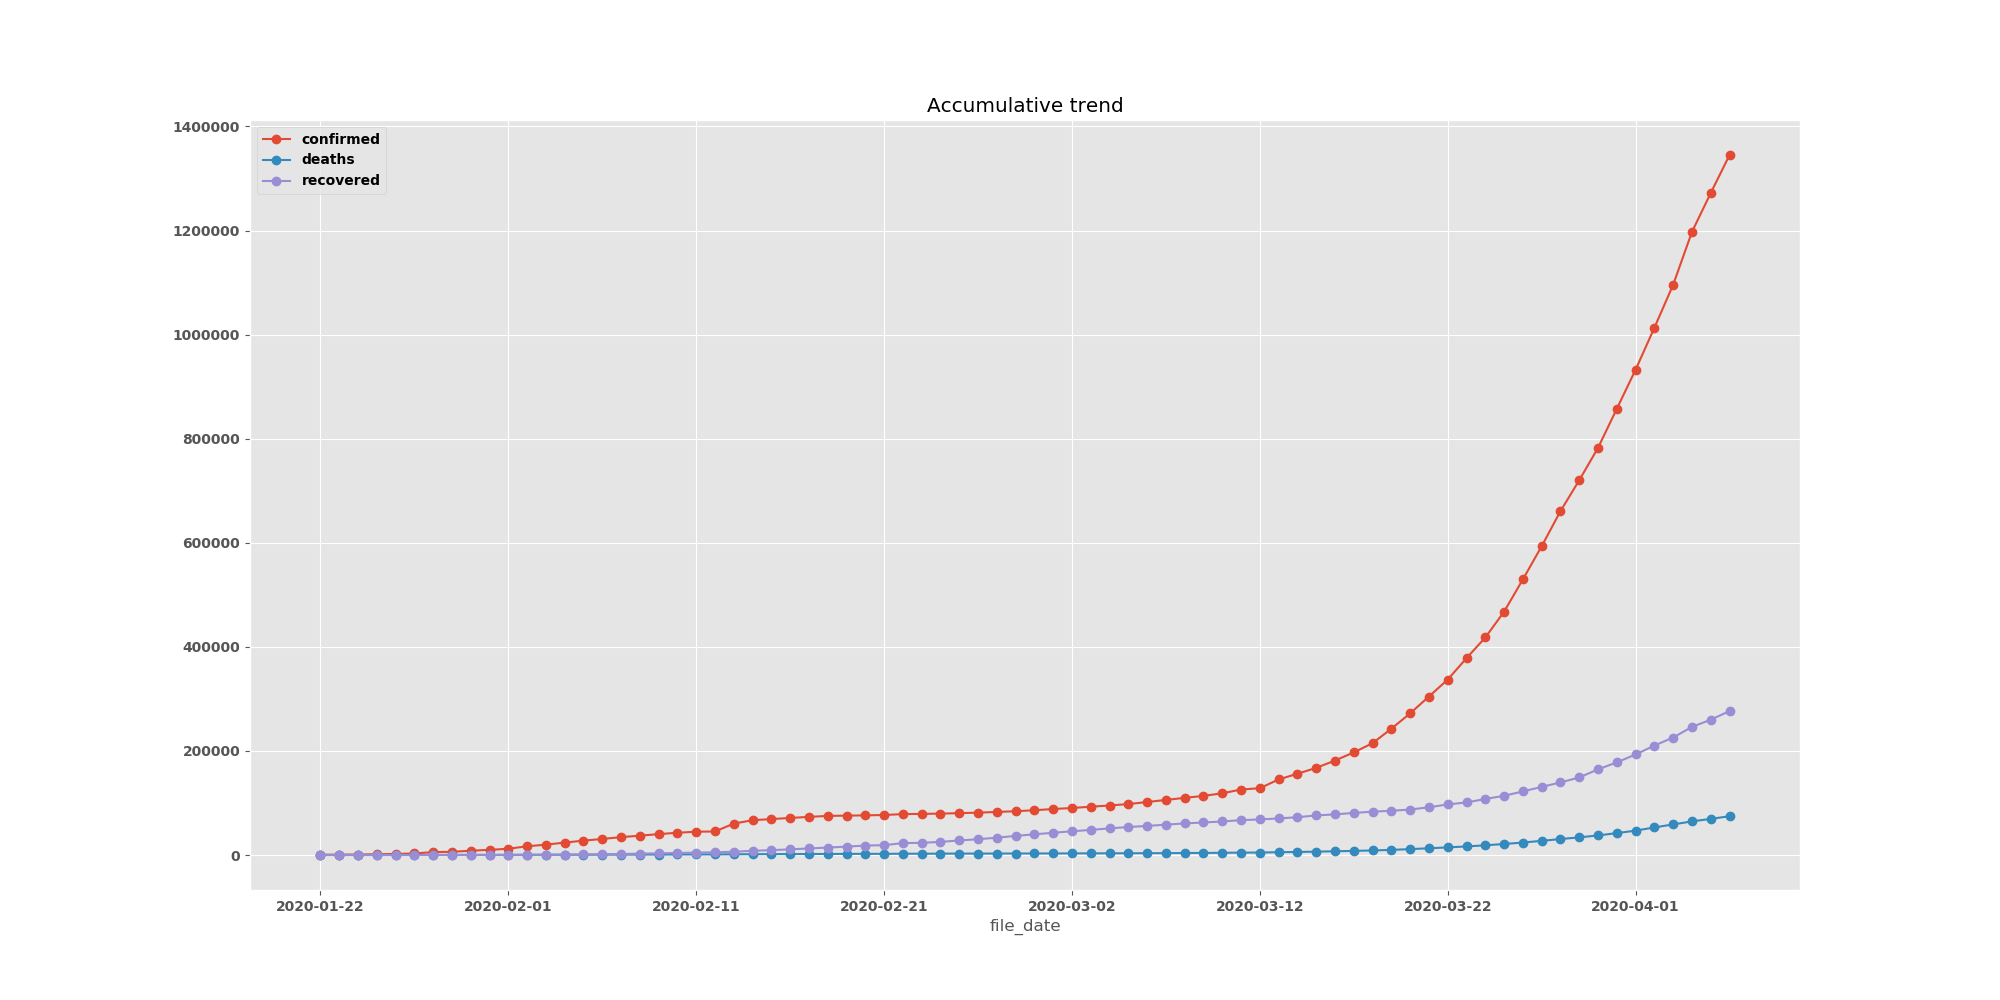
This is an accumulative sum trendline for all the confirmed cases, deaths and recoveries.
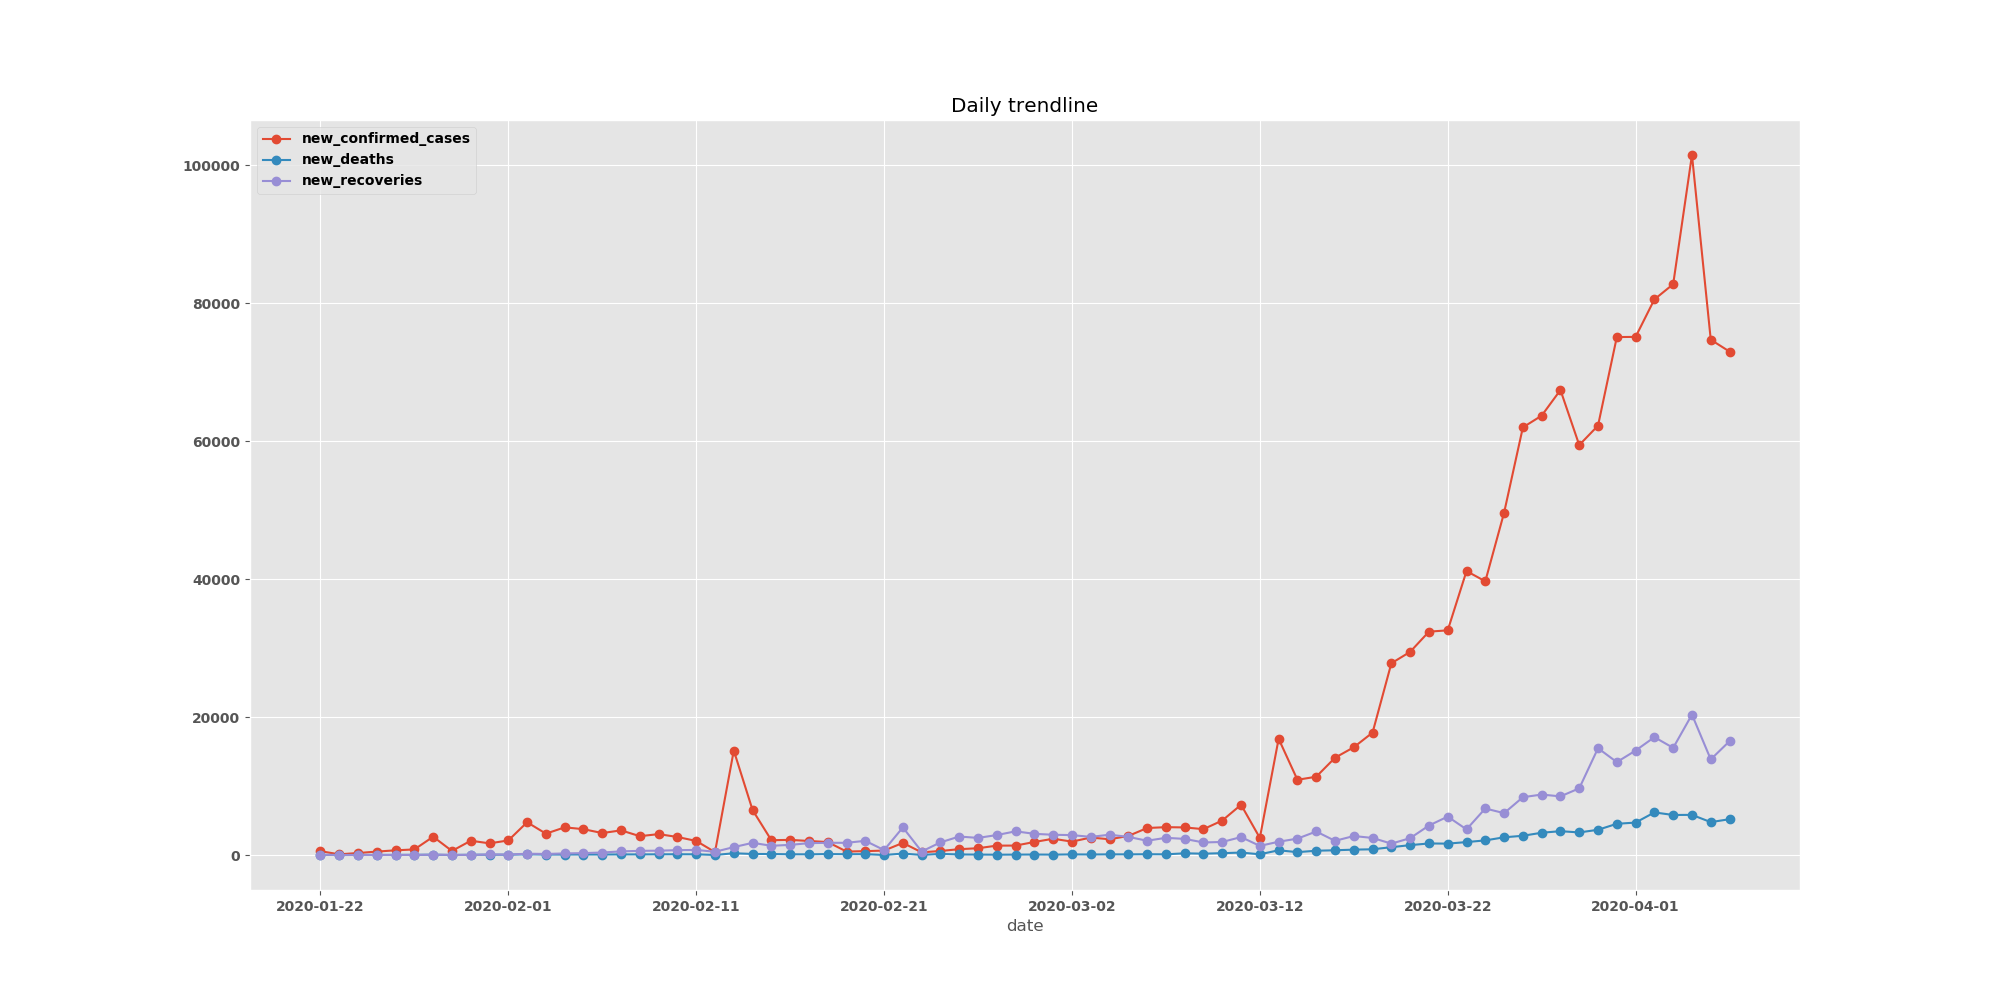
This is a daily sum trendline for all the confirmed cases, deaths and recoveries.
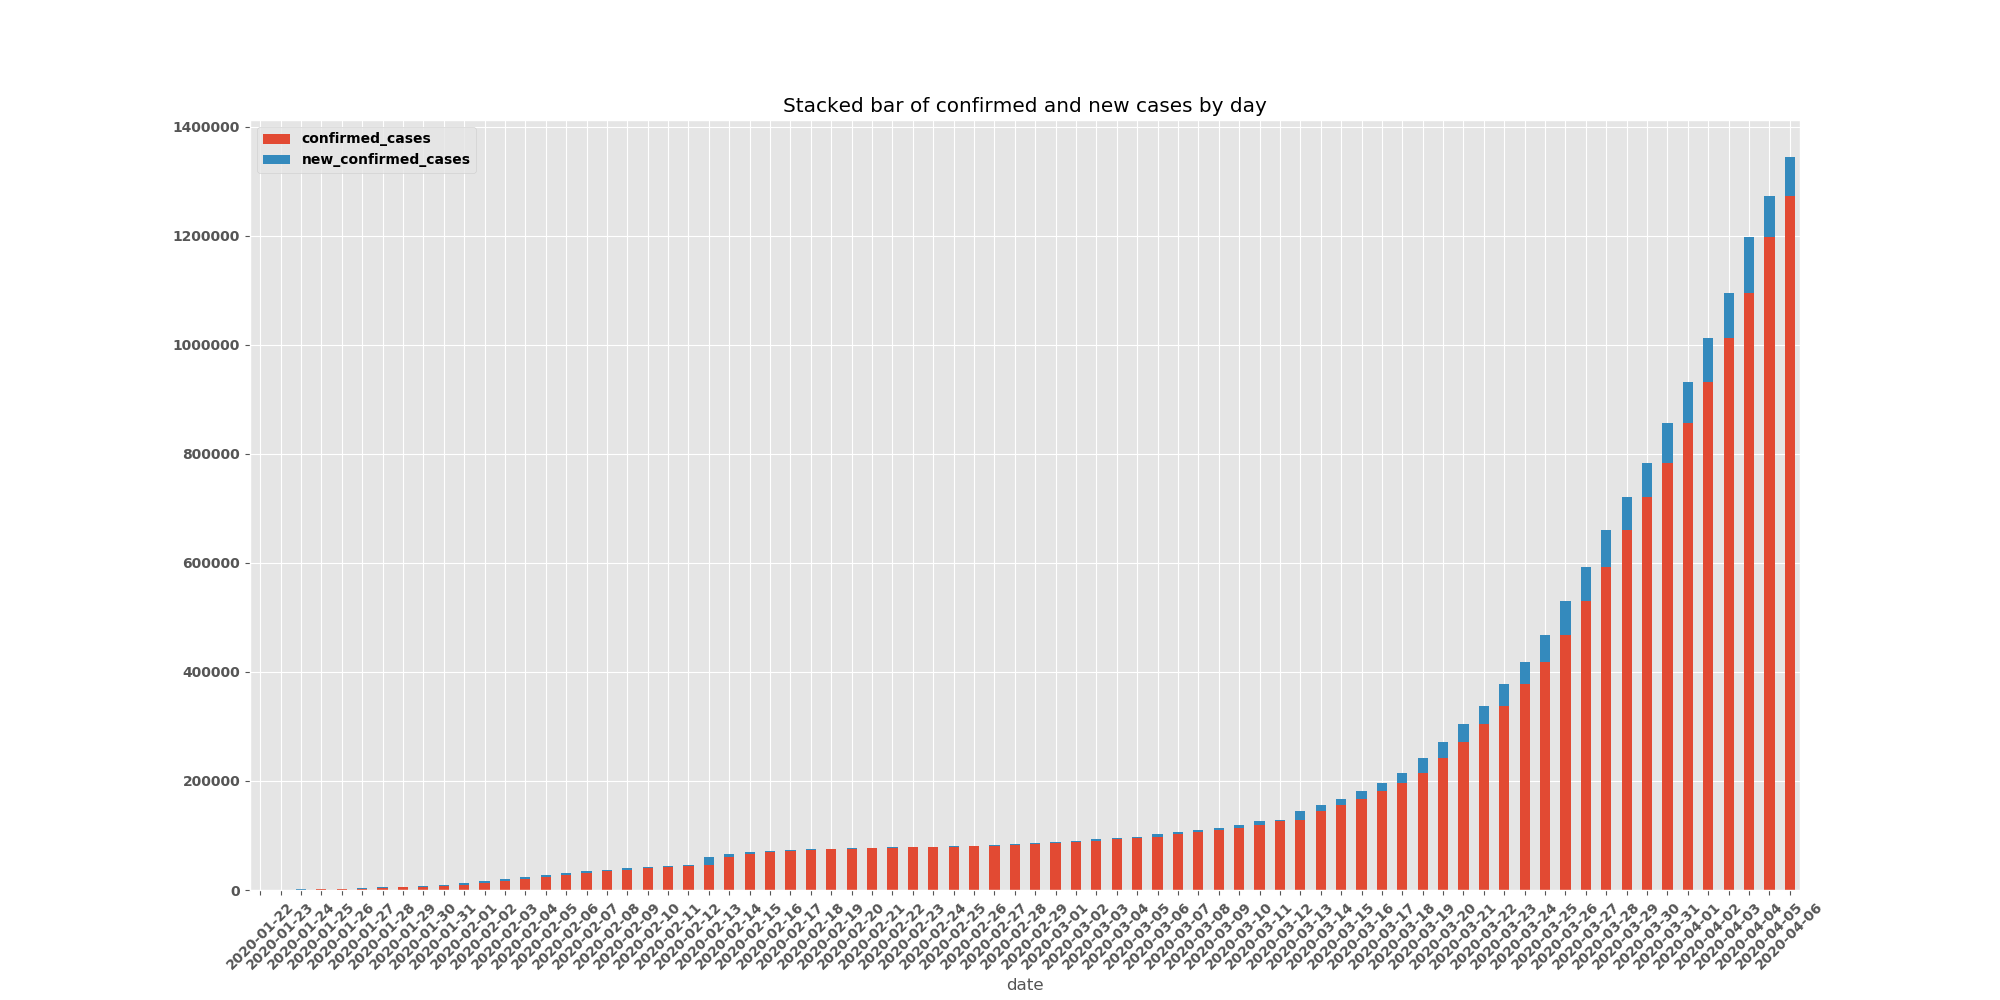
This stacked bar chart shows a daily sum of people who are already confirmed (red) and the people who have been confirmed on that date (blue)
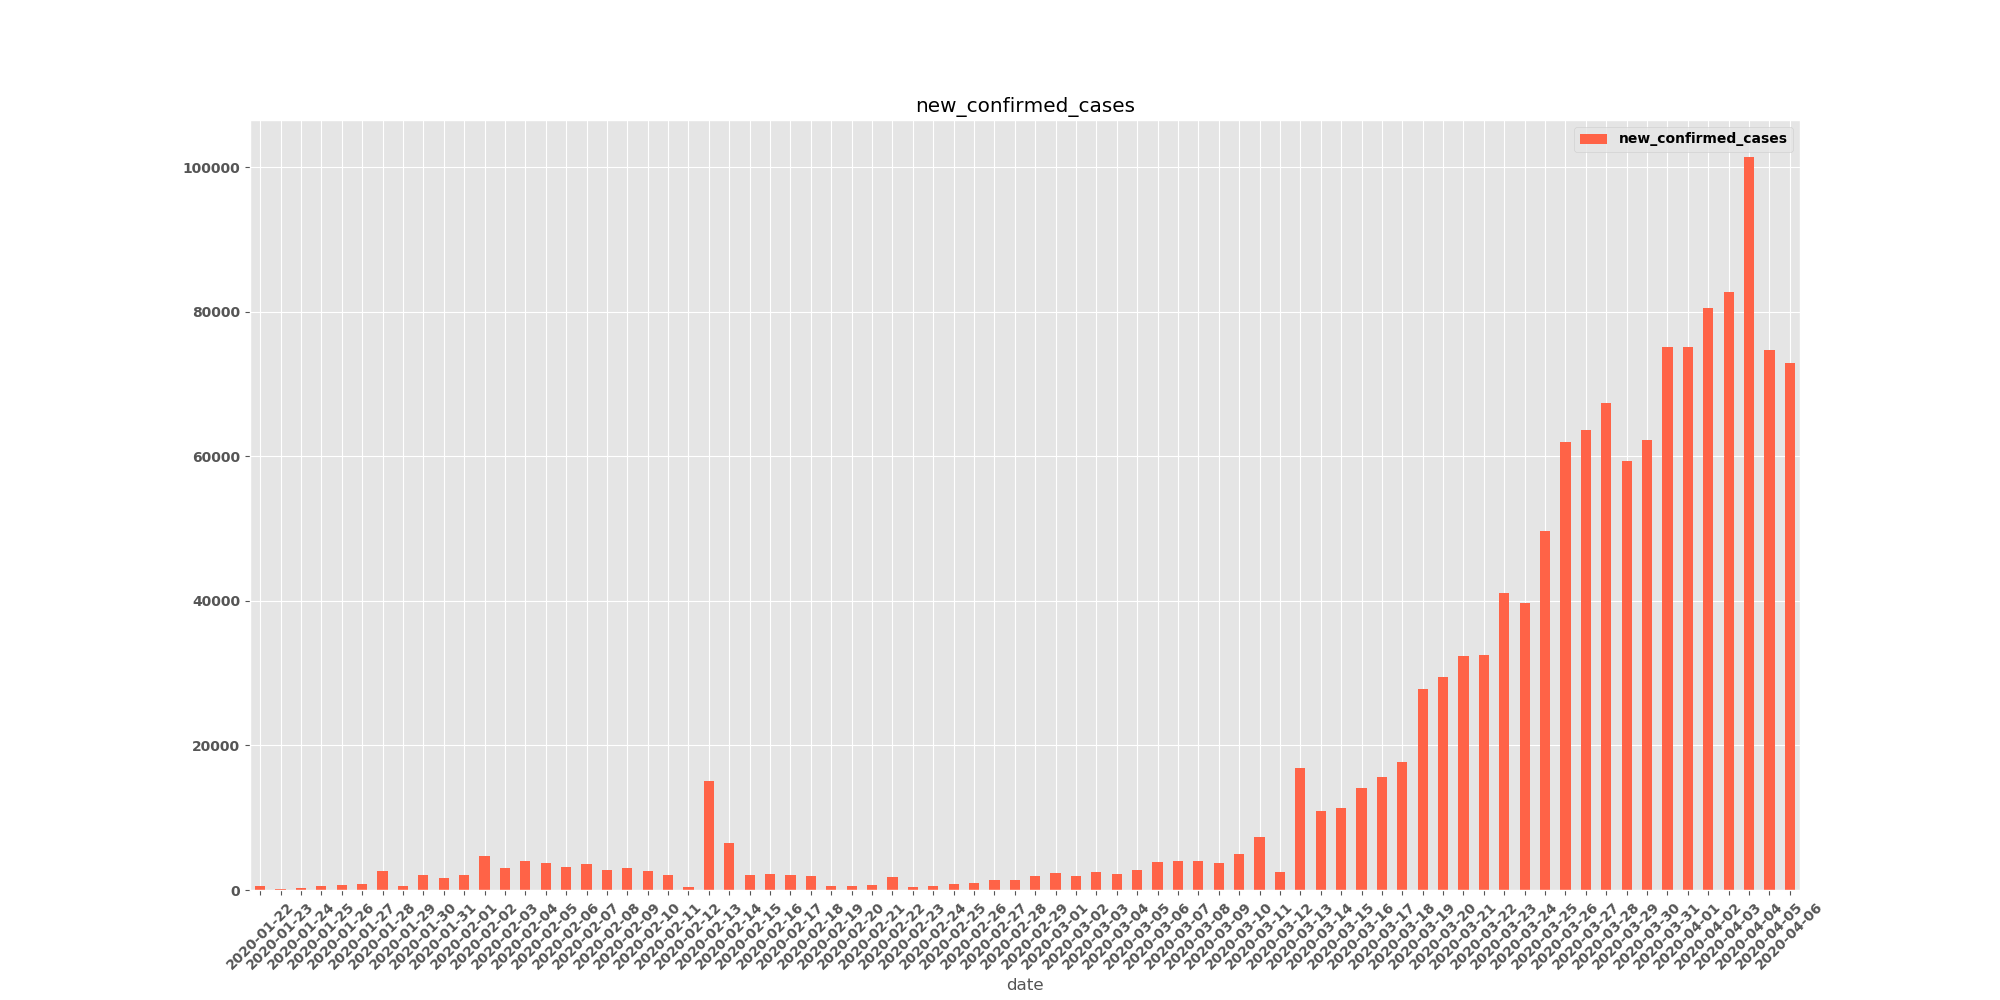
A count for new cases on a given date, does not take past confirmations into account.
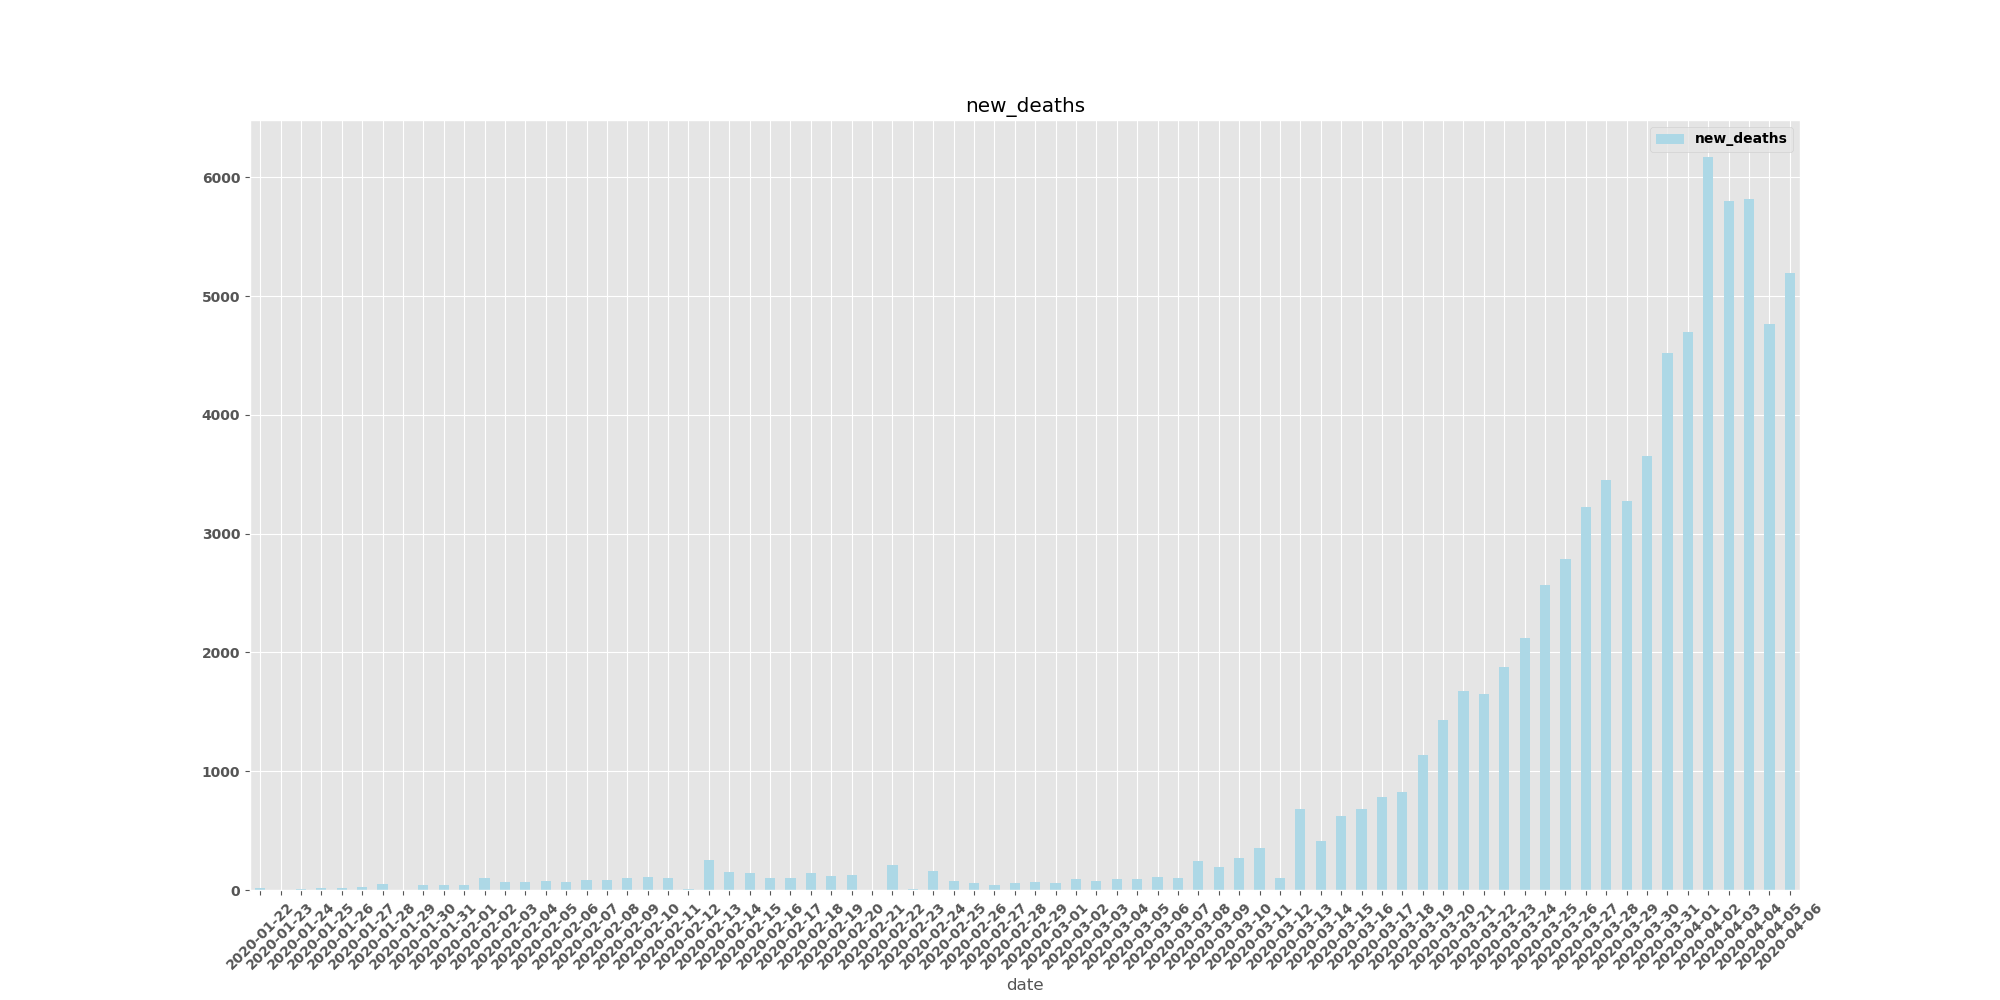
A count for deaths on a given date, does not take past deaths into account.
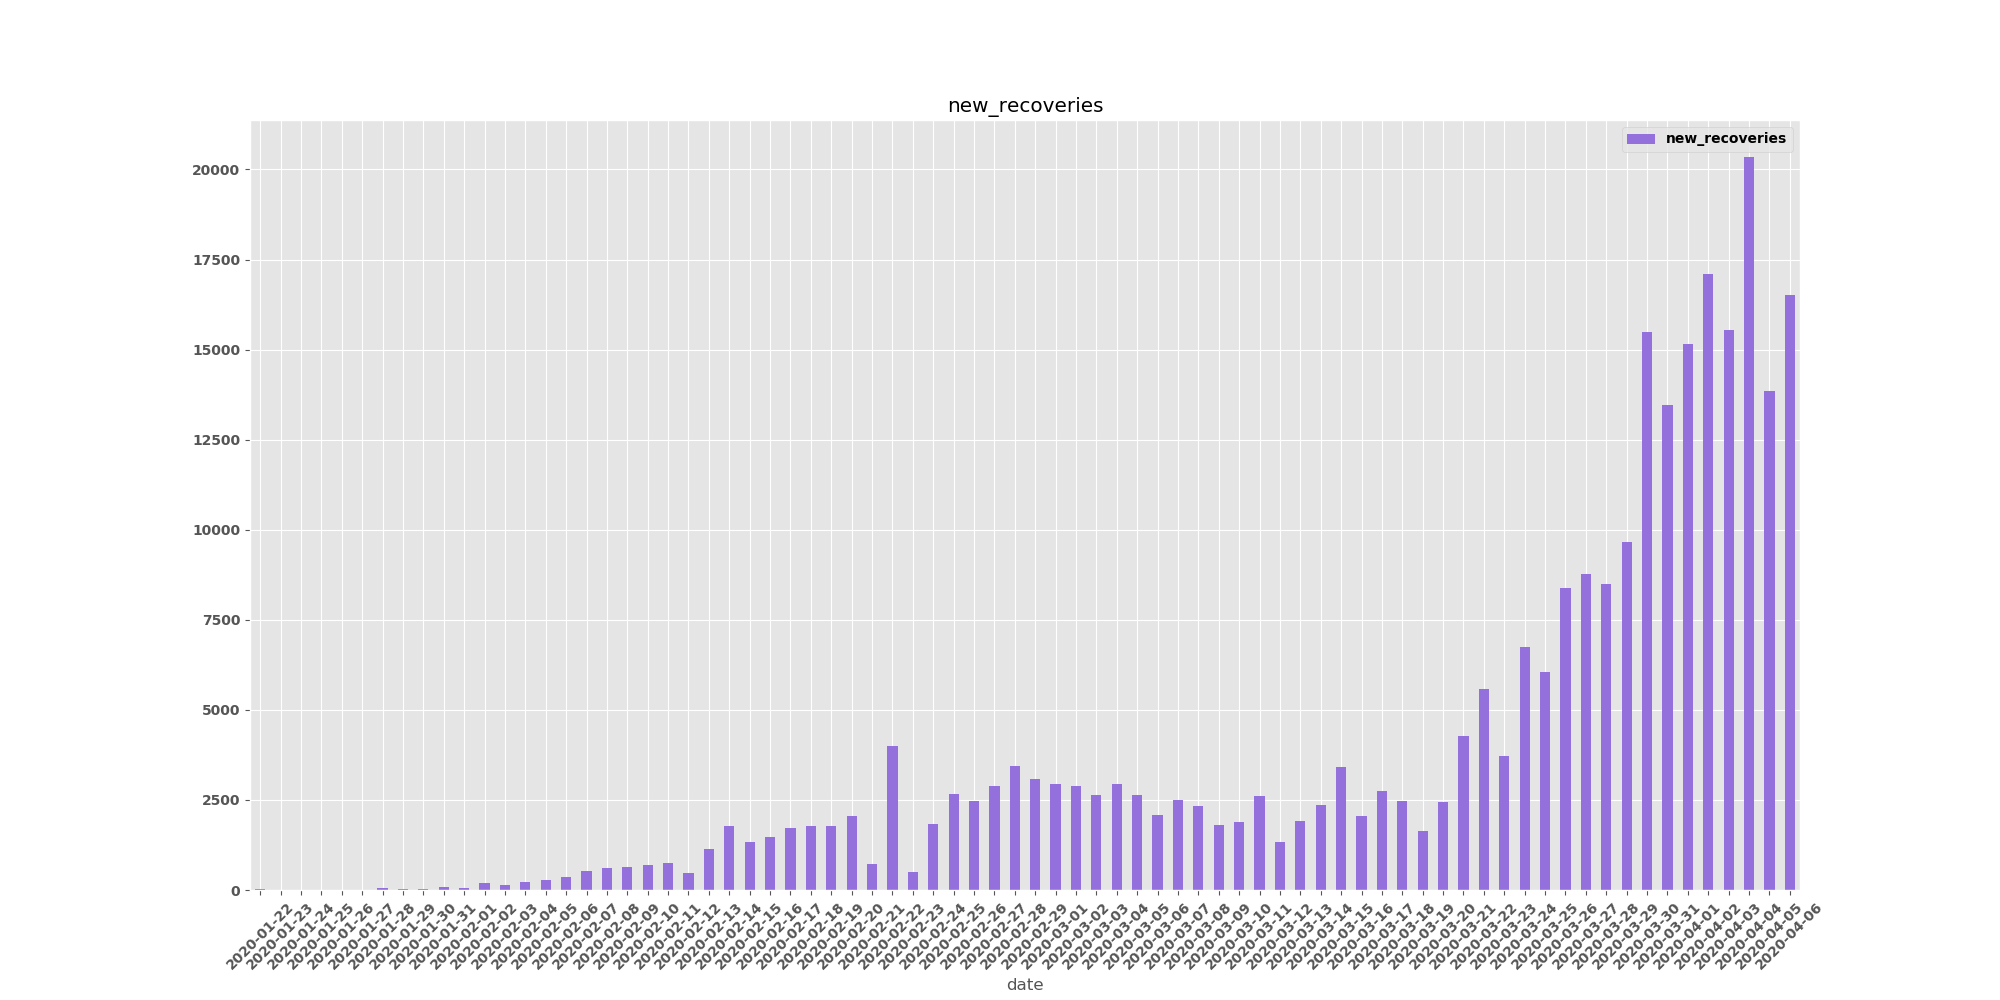
A count for new recoveries on a given date, does not take past recoveries into account.
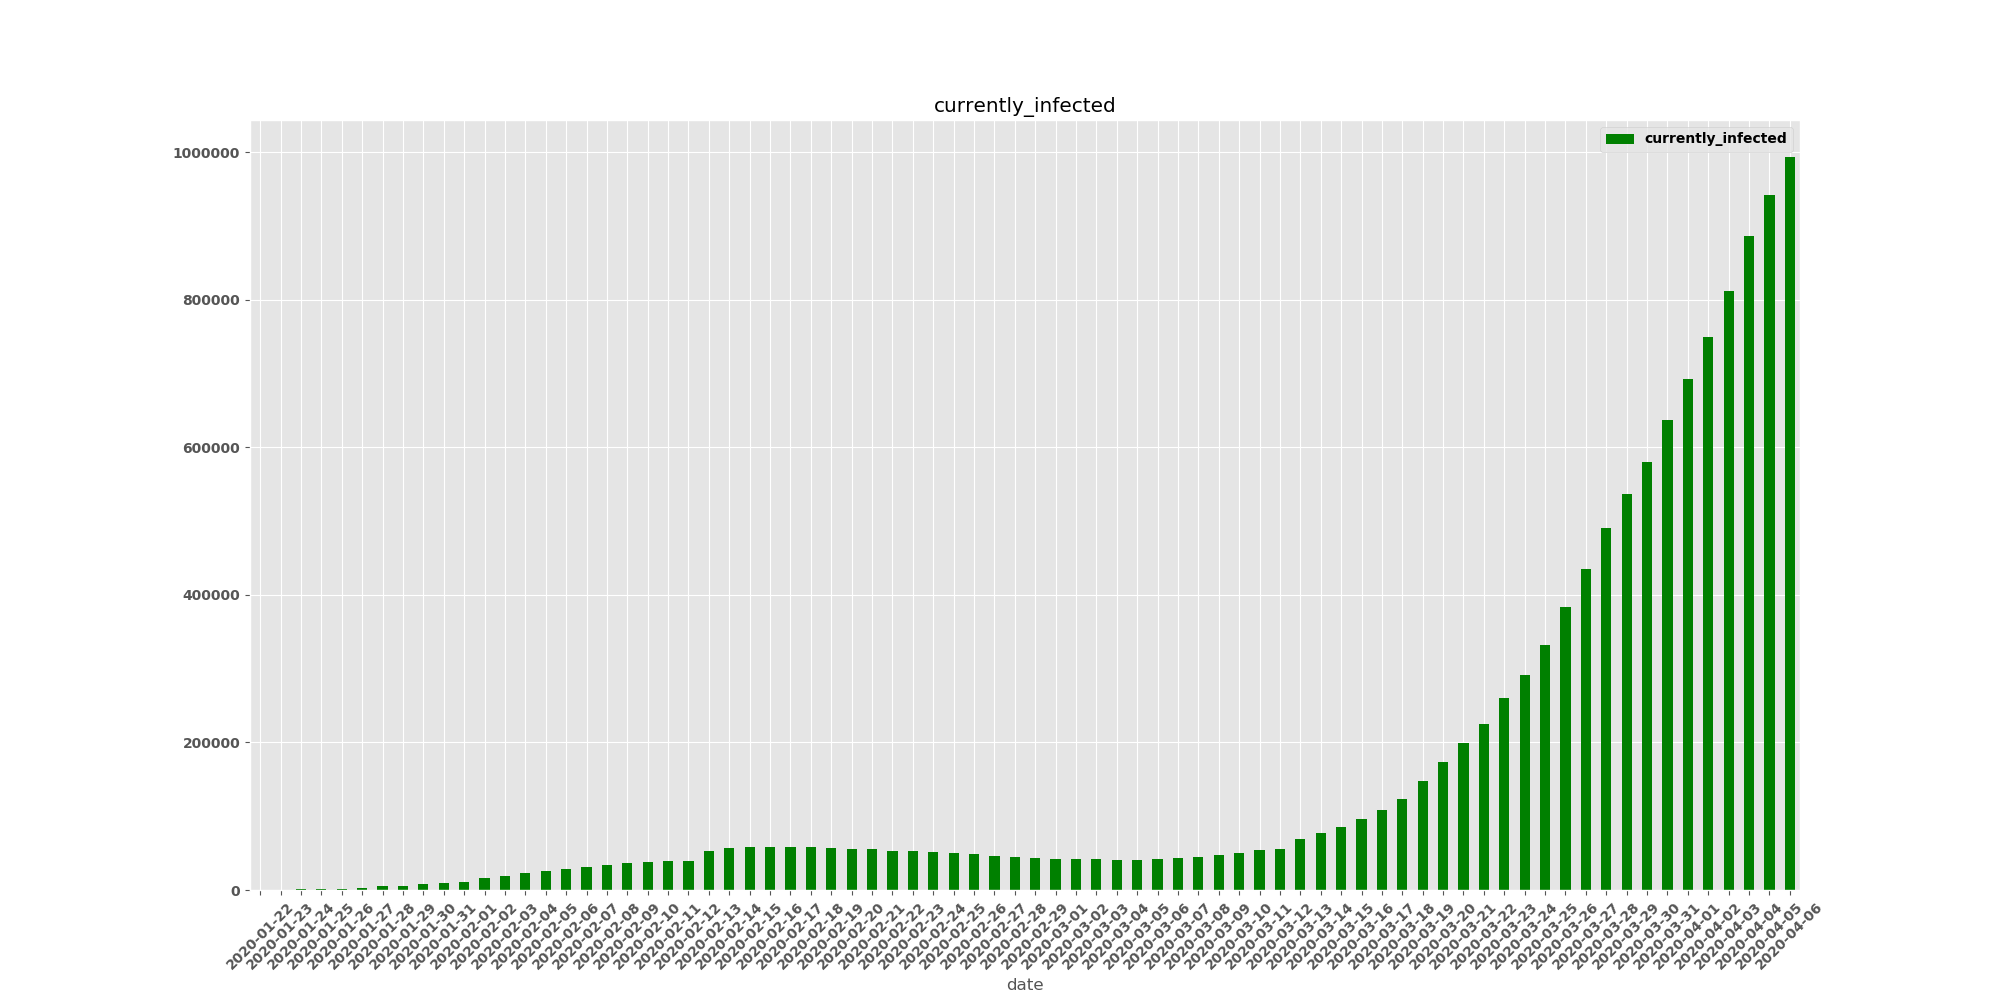
A count for all the people who are currently infected for a given date.
- Written by me (Aaron Ward - https://www.linkedin.com/in/aaronjward/)
- A special thank you to the JHU CSSE team for maintaining the data
- Also a special thank you to @ajaymaity for bug fixes 🎉


