Used Python (Pandas, and Matplotlib) and SQLAlchemy to do basic climate analysis and data exploration.
-
Choosed a start date and end date for my trip. My vacation range is approximately 3-15 days total.
-
Used SQLAlchemy
create_engineto connect to your sqlite database. -
Used SQLAlchemy
automap_base()to reflect my tables into classes and save a reference to those classes calledStationandMeasurement.
-
Designed a query to retrieve the last 12 months of precipitation data.
-
Loaded the query results into a Pandas DataFrame and set the index to the date column.
-
Sorted the DataFrame values by
date. -
Ploting the results using the DataFrame
plotmethod.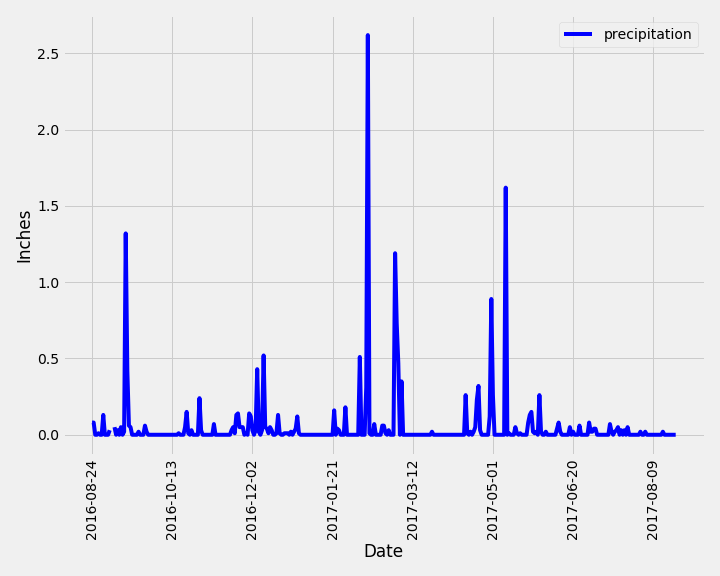

-
Designed a query to calculate the total number of stations.
-
Designed a query to find the most active stations.
-
Listed the stations and observation counts in descending order.
-
Which station has the highest number of observations?
-
-
Designed a query to retrieve the last 12 months of temperature observation data (TOBS).
-
Filtered by the station with the highest number of observations.
-
Ploting the results as a histogram with
bins=12.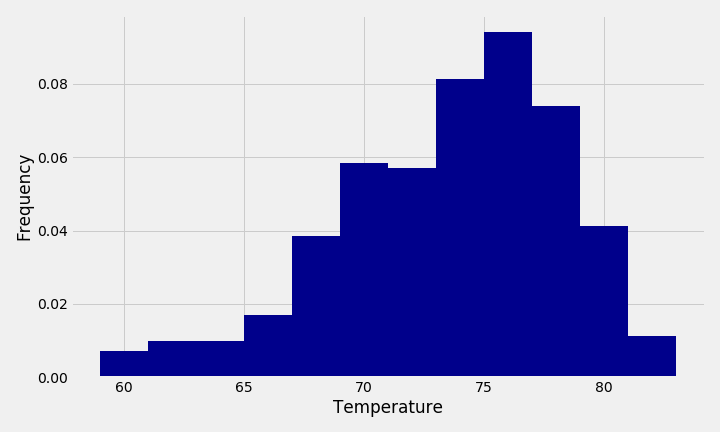
-

Designed a Flask API based on the queries that I have just developed.
- Used Flask to create my routes.