Implementation of the code for the paper titled "Learning Energy-Efficient Driving Behaviors by Imitating Experts". To learn more, see the following links:
- Paper: TODO
- Website: https://sites.google.com/view/il-traffic/home
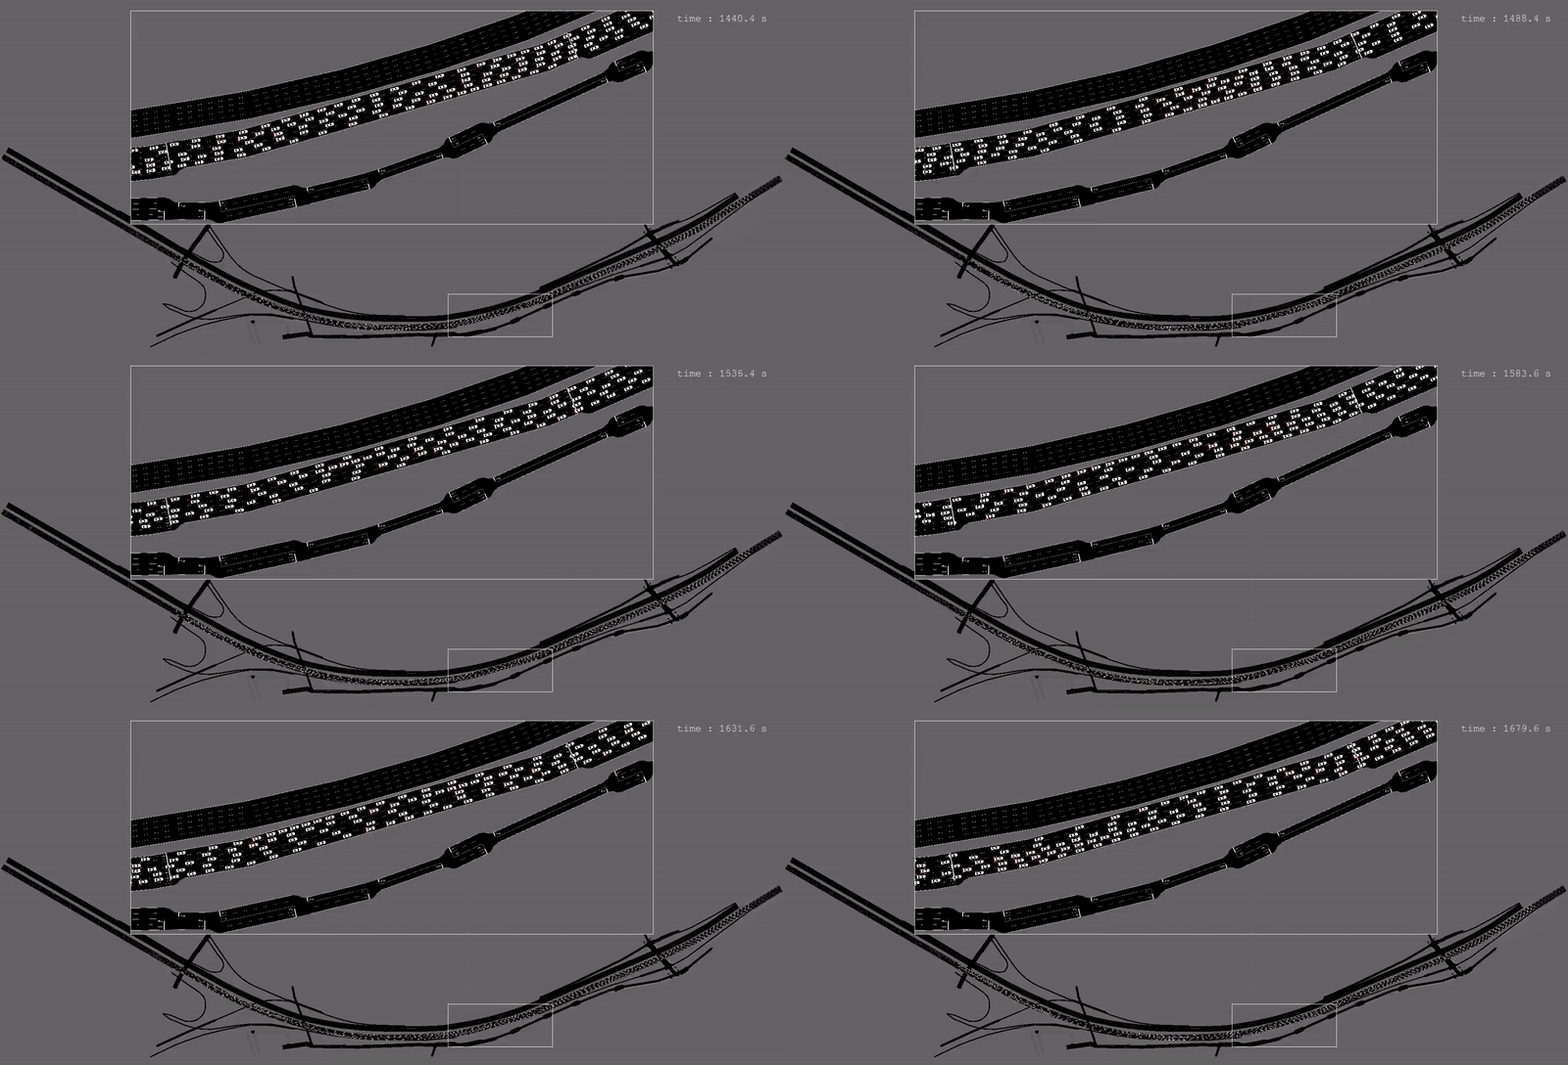
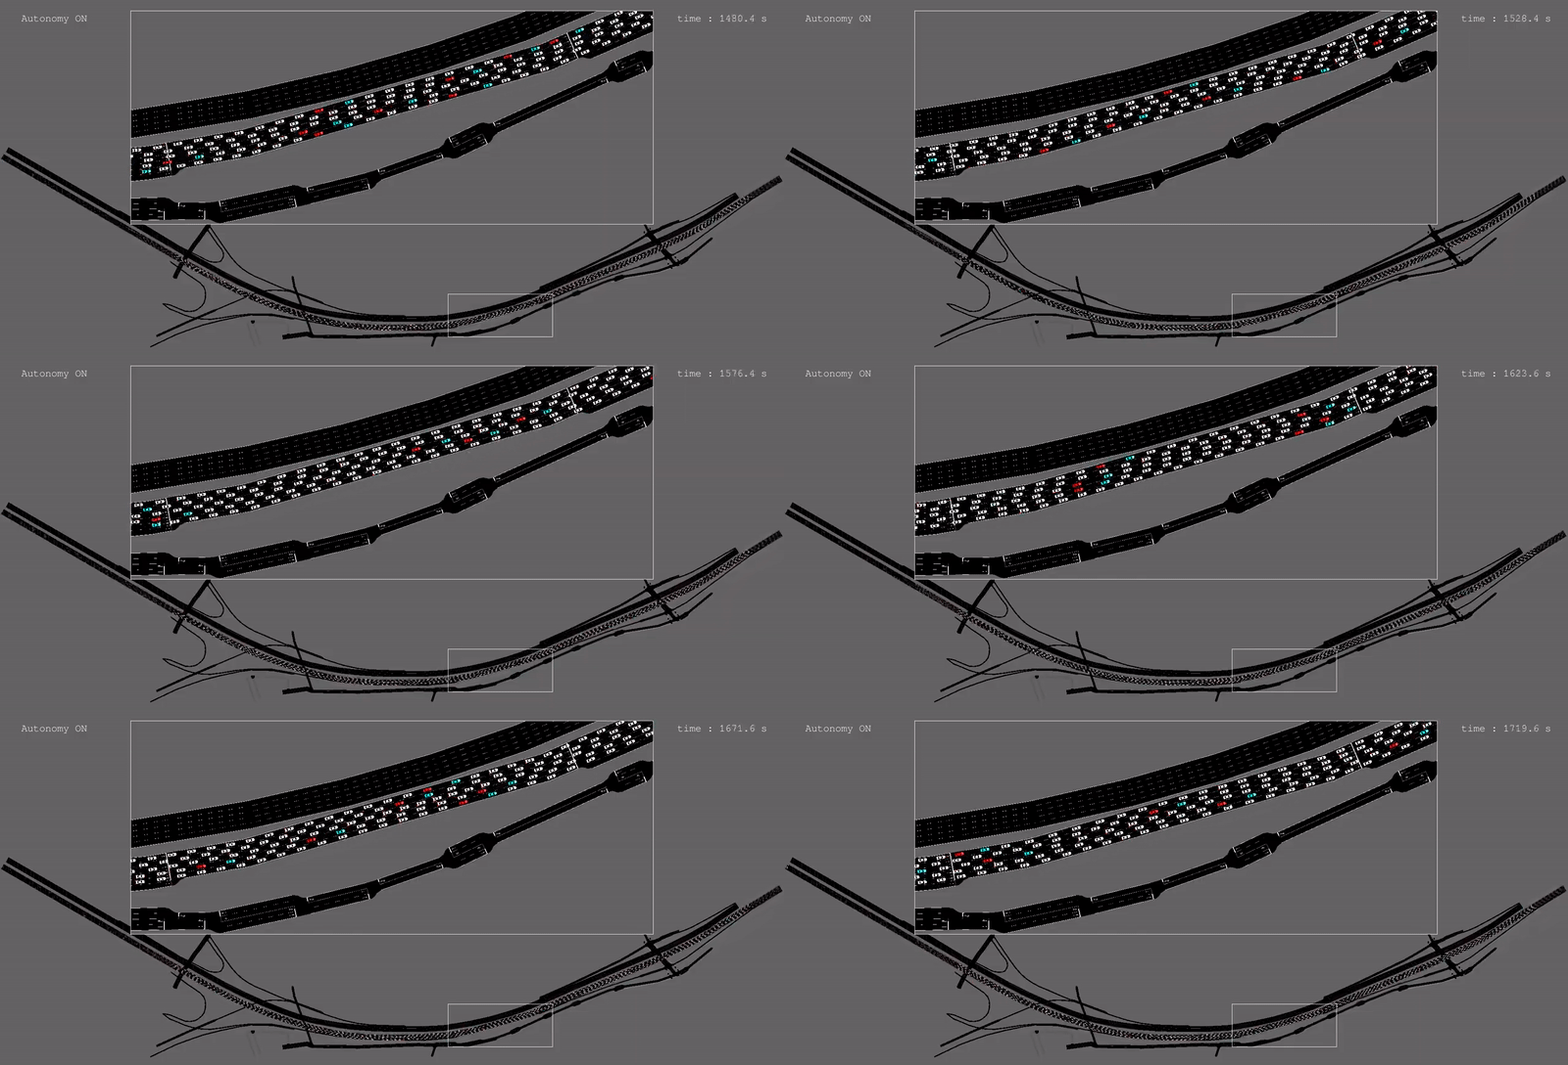
Imitation results on I-210. Left: baseline with stop-and-go waves. Right: imitated policy allowing for wave dissipation
- Setup Instructions
1.1. Basic Installation
1.2. Docker Installation - Usage
2.1. Simulating Baseline and Expert Models
2.2. Imitating Experts
2.3. Evaluating Results
2.4. Downloading Models and Results - Citing
This repository is an extension of the Flow repository. If you have not previously installed Flow, begin by following the setup instruction provided here. Note that if you are experiences issues with this, you may want to consider downloading and using the docker image instead (see Section 1.2).
Once Flow has been installed, open a terminal and set the working directory of the terminal to match the path to this repository:
cd path/to/il-trafficIf you have installed Flow in conda environment, you will want to install this repository in the same environment. If you followed the basic Flow setup instructions, this can be done my running the following command:
source activate flowFinally, install the contents of the repository onto your conda environment (or your local python build) by running the following command:
pip install --use-deprecated=legacy-resolver -e .If you would like to (optionally) validate that the repository successfully installed and is running, you can do so by executing the unit tests as follows:
nose2The test should return a message along the lines of:
----------------------------------------------------------------------
Ran XXX tests in YYYs

OK
The current working version of Flow is missing some features, thereby preventing some operations within this repository from successfully running. As a temporary measure, we have created a docker image that can be used to run any commands described within this README. To get the docker image running, first be sure to set up docker on your machine. Next, download the docker image for this repository by clicking on this link. The link will download a "il-traffic.tar" file containing the contents of the docker image. To install the image onto your machine, run:
docker load -i il-traffic.tarOnce this is done, you can run any command provided in this repository by
prefixing it with docker run -it --rm il-traffic, replacing python with
python3, and initializing the path to the script with /. For example, if
you wish to run a simulation,
type:
docker run -it --rm il-traffic python3 /il_traffic/scripts/simulate.pyNote: When using graphical features with the docker image, care must be taken to provide the display information to the docker execution script above. The way in which this is done also differs from machine to machine, making it difficult to arbitrarily assign in this document.
Another consideration when using docker is the redirection of logged data. The
above script alone will not send any generated trajectory or imitation data to
the host server. Instead, it will assume the data is to be stored in the image,
and subsequently deleted once the instance is over. To redirect data to your
local (host) machine, you will need to use the -v flag within docker. This
can be done for each relevant script as follows:
-
Simulation
docker run -it --rm -v $PWD/expert_data:/expert_data il-traffic python3 /il_traffic/scripts/simulate.py # plus additional arguments
-
Imitation
docker run -it --rm -v $PWD/imitation_data:/imitation_data il-traffic python3 /il_traffic/scripts/imitate.py # plus additional arguments
-
Evaluation (assuming the path to the trained model is under
MODEL_PATH)docker run -it --rm -v $MODEL_PATH:$MODEL_PATH il-traffic python3 /il_traffic/scripts/evaluate.py $MODEL_PATH # plus additional arguments
We describe in the following subsections how different hand-designed baseline and AV (expert) models can be simulated within different networks, and describe the imitation and evaluation procedures. Results from previous runs using this repository can further be downloaded and visualized through the final subsection.
Through this repository, simulations of both baseline (human-driven) behaviors
and mixed-autonomy behaviors in which AVs follow a variety of different
controllers can be conducted through the simulate.py script. The networks
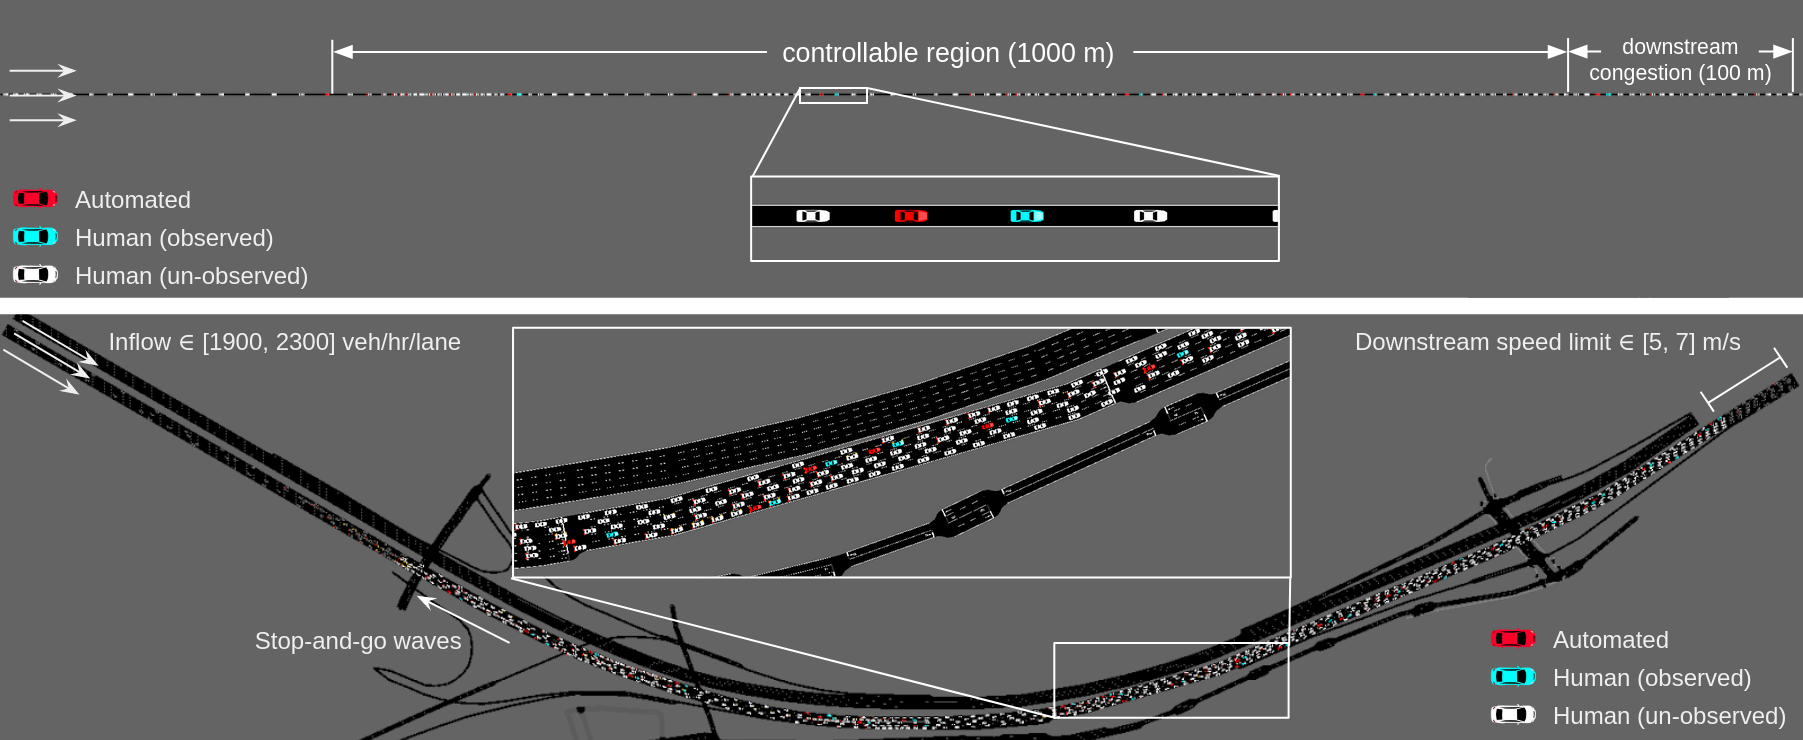
explored in this repository, see the figure below, include a single lane
highway and simulated version of the I-210 network. A description of the
process through which congestion forms in these model is available in our
paper.
To execute a simulation of the network, run:
python il_traffic/scripts/simulate.pywhere the descriptions to additional arguments can be seen by running:
python il_traffic/scripts/simulate.py --helpThe above script will start a simulation of the network that can be visualized
if --render is set. Moreover, if --gen_emission is set, this script will
create a folder in "expert_data/{network}/{controller}/{inflow}-{end_speed}"
containing the following files:
- avg-speed.png : a plot of the avg/std speeds of all vehicles at every time step.
- emission.csv : the trajectory data collected from the simulation, containing values that denote the speed, position, and accelerations conducted by all vehicles at all time steps.
- mpg.csv : the energy values each individual vehicle experiences after moving forward for 50 meters (in miles-per-gallon, or mpg).
- mpg.png : a plot of the mpg values contained in mpg.csv, with a line plot used to represent the average values across time.
- ts-{0-4}.png : visualization of the trajectories of individual vehicles as seen as a time-space diagram on each individual lane. The number after the dash represents the lane number (0 for the highway and 0-4 for the I-210).
- tt.json : the time it takes every vehicle to traverse the network to the downstream edge.
The behaviors of the baseline and expert controllers presented in the
subsection above can be imitated to a neural network policy (or an ensemble of
policies) through the imitate.py method in the "scripts" folder. This
method implements the DAgger algorithm, and provides additional augmentations
to allow for the training of ensembles of (optionally stochastic) policies, as
well as various other features such as dropout and batch normalization. To
start the imitation procedure, run:
python il_traffic/scripts/imitate.pywhere the descriptions to additional arguments can be seen by running:
python il_traffic/scripts/imitate.py --helpOnce the imitation procedure has begun, it will create an "imitation_data" folder which will store the trained model after every training iteration. The folder will also contain a tensorboard log and "train.csv" file that describe the performance of the model at every iteration.
Once a given expert has been imitated, the performance of the model can be
verified through the evaluate.py method by running:
python il_traffic/scripts/evaluate.py "/path/to/results_folder"where the first argument is the path to the folder created by the imitation method before, and the additional arguments can be seen by running:
python il_traffic/scripts/evaluate.py --helpIf the --gen_emission flag has been set, the script will create a new
"results" folder in the original folder with the model containing trajectory
data similar to the one created by the
simulation procedure.
The trained models and trajectories provided within the paper and website are
available to be downloaded and further analyzed. To download the existing
models and trajectories, click on any of the relevant links below. For the
trajectory data, the individual folders will contain content similar to what is
produced by the simulate.py and evaluate.py scripts.
- Trained models:
| Controller | Model (5 seeds) |
|---|---|
| Imitated (1 frame) | 1 - 2 - 3 - 4 - 5 |
| Imitated (5 frames) | 1 - 2 - 3 - 4 - 5 |
- Trajectories for different penetration rates:
| Controller | Penetration Rate | Trajectories (5 seeds) |
|---|---|---|
| Baseline | 0 % | 1 - 2 - 3 - 4 - 5 |
| Follower Stopper | 2.5 % | 1 - 2 - 3 - 4 - 5 |
| 5.0 % | 1 - 2 - 3 - 4 - 5 | |
| 7.5 % | 1 - 2 - 3 - 4 - 5 | |
| 10.0 % | 1 - 2 - 3 - 4 - 5 | |
| Imitated (1 frame) | 2.5 % | 1 - 2 - 3 - 4 - 5 |
| 5.0 % | 1 - 2 - 3 - 4 - 5 | |
| 7.5 % | 1 - 2 - 3 - 4 - 5 | |
| 10.0 % | 1 - 2 - 3 - 4 - 5 | |
| Imitated (5 frames) | 2.5 % | 1 - 2 - 3 - 4 - 5 |
| 5.0 % | 1 - 2 - 3 - 4 - 5 | |
| 7.5 % | 1 - 2 - 3 - 4 - 5 | |
| 10.0 % | 1 - 2 - 3 - 4 - 5 |
- Trajectories from robustness tests:
| Controller | Trajectories (5 seeds) |
|---|---|
| Baseline | 1 - 2 - 3 - 4 - 5 |
| Follower Stopper | 1 - 2 - 3 - 4 - 5 |
| Imitated (1 frame) | 1 - 2 - 3 - 4 - 5 |
| Imitated (5 frames) | 1 - 2 - 3 - 4 - 5 |
To cite this repository in publications, use the following:
TODO


