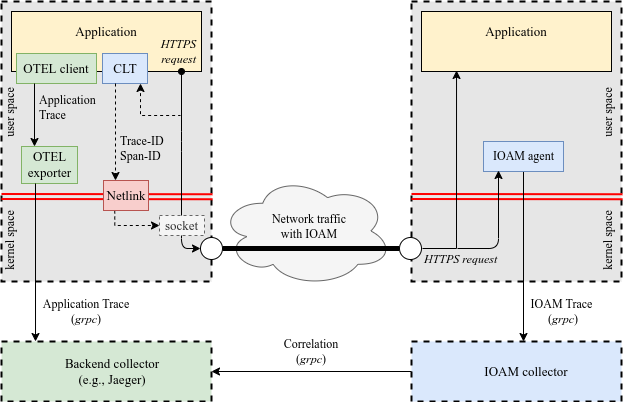
The Cross-Layer Telemetry (CLT) project is based on IOAM (for IPv6) in the Linux kernel and aims to make the entire network stack (L2 -> L7) visible for distributed tracing tools instead of the classic L5 -> L7 visibility.
The chosen Application Performance Management (APM) tool based on distributed tracing is OpenTelemetry, which is the new standard. The chosen backend for data visualization is Jaeger, although CLT is generic enough to work with other backends. Only the IOAM collector, an interface between the IOAM agent and a tracing backend, is backend-specific and can easily be implemented for other alternatives than Jaeger.
Some key components are crucial for the CLT ecosystem:
- a recent kernel with IOAM (>= 5.17) patched for Cross-Layer Telemetry
- the CLT client library in Python or in Go
- an IOAM Agent
- an IOAM Collector
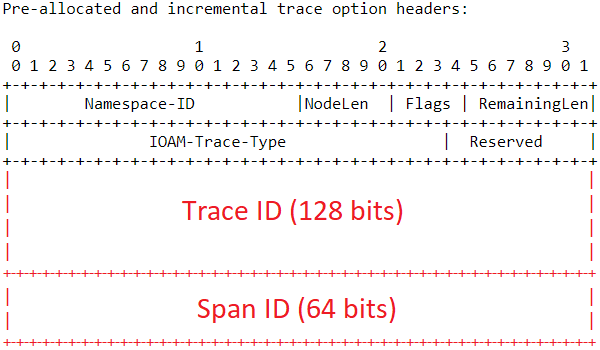
CLT correlates APM traces with network telemetry, based on APM trace and span IDs. Both IDs are carried by IOAM in the dataplane, right after the IOAM Pre-allocated Trace Option-Type Header. As a result, APM traces in data visualization will include network telemetry.
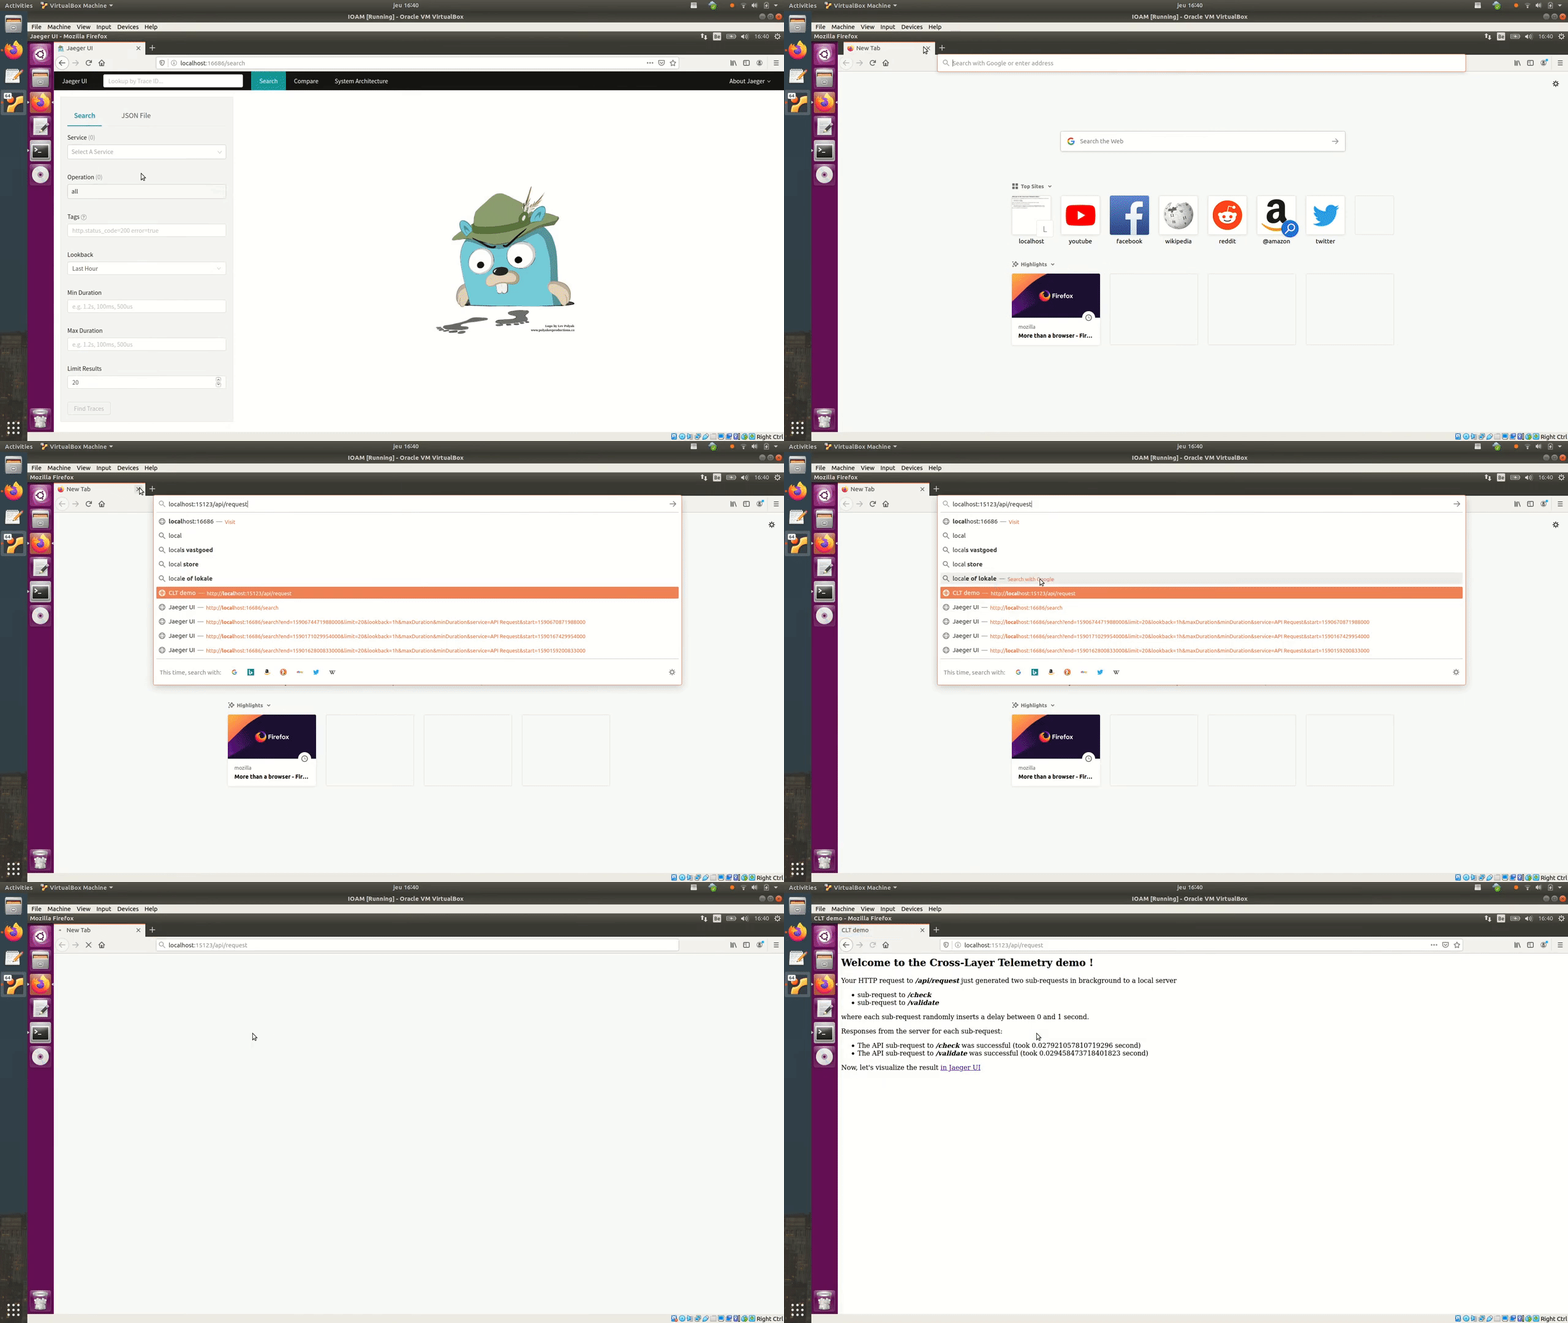
You can watch the entire demo by clicking on the following video:
Note: this video was for a previous version of CLT, but it's still the same result globally.
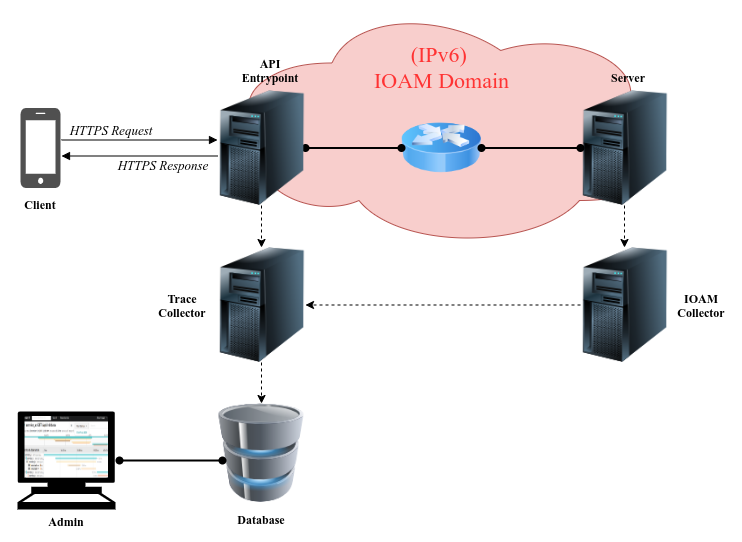
A client (mobile phone) sends a login request to an API entrypoint, which one triggers a sub-request to a server. The monitoring happens inside the (IPv6) IOAM domain, i.e., each request between the API entrypoint and the server.
Prerequisites:
- an IOAM kernel (>= 5.17) patched for CLT
- docker installed (tested with:
Docker version 20.10.17, build 100c701) - docker-compose installed (tested with:
docker-compose version 1.25.5, build 8a1c60f6)
Go to the demo folder and run the following command to build the virtual topology (the same as the example above):
docker-compose up -d
Once started, open app_login.html in your browser. You can enter whatever username/password you want, but only clt (username) and clt (password) will succeed. Each login request is recorded and enhanced with network telemetry (thanks to IOAM data). Follow instructions on the screen and have fun looking at enhanced application traces.
To simulate a congestion on the router inside the (IPv6) IOAM domain, enter the following command:
docker exec porthos /sbin/tc qdisc add dev eth1 root netem delay 1000ms
Try again to log you in. You'll notice that the congestion is reported by IOAM inside application traces. You might need several simultaneous login attempts to see it, so that the queue starts filling.
When you're done, just run:
docker-compose down


