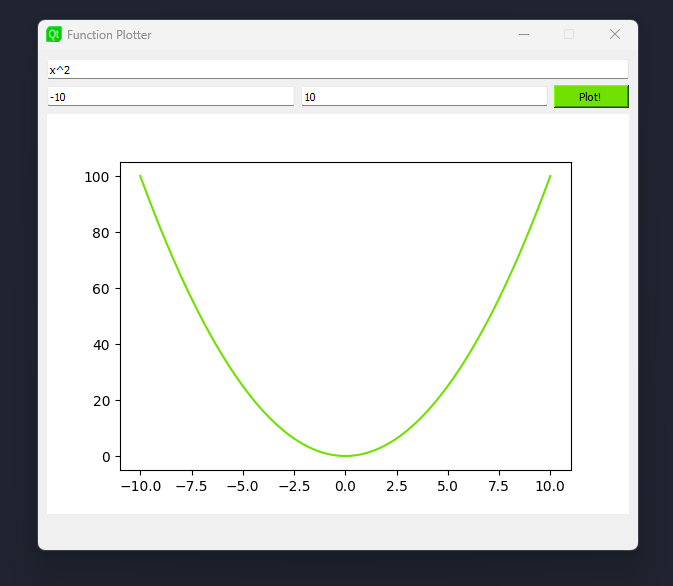
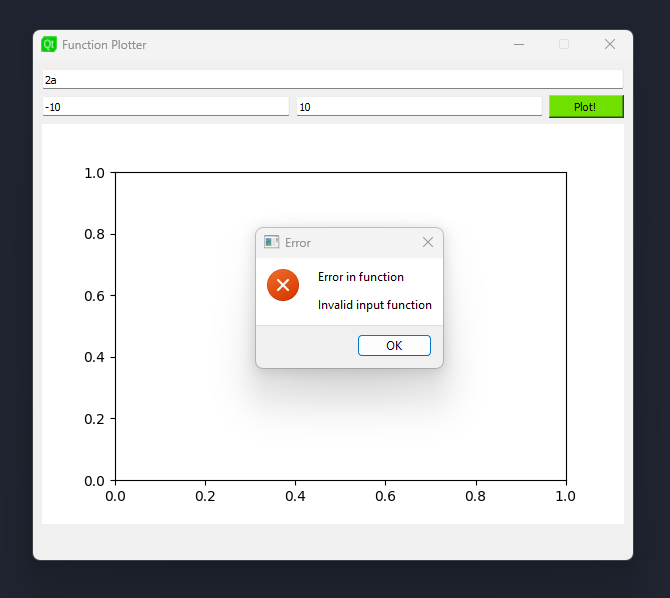
A simple function plotter that allows you to plot mathematical functions in a graphical window using Pyside2.
- Plots a variety of mathematical functions, including polynomials, trigonometric functions, and exponential functions.
- Allows you to specify the range of values that the function should be plotted over.
- Uses the matplotlib library to create the graphical window.
- Tested using the pytest-qt plugin.
- Enter the function you want to plot in the
Enter Functiontext box. - Enter the minimum and maximum values of the function in the
Min ValueandMax Valuetext boxes. - Click the
Plot!button.
- Python 3.7
- Pyside2
- matplotlib
- numpy
- sympy
To run the program, simply execute the following command from the command line:
python app.py
To run the program, simply execute the following command from the command line:
pytest -q test.py
Contributions are welcome! Please open an issue or a pull request if you have any ideas for improvements.
I hope you enjoy using the function plotter!
This README file created with the help of BARD.


