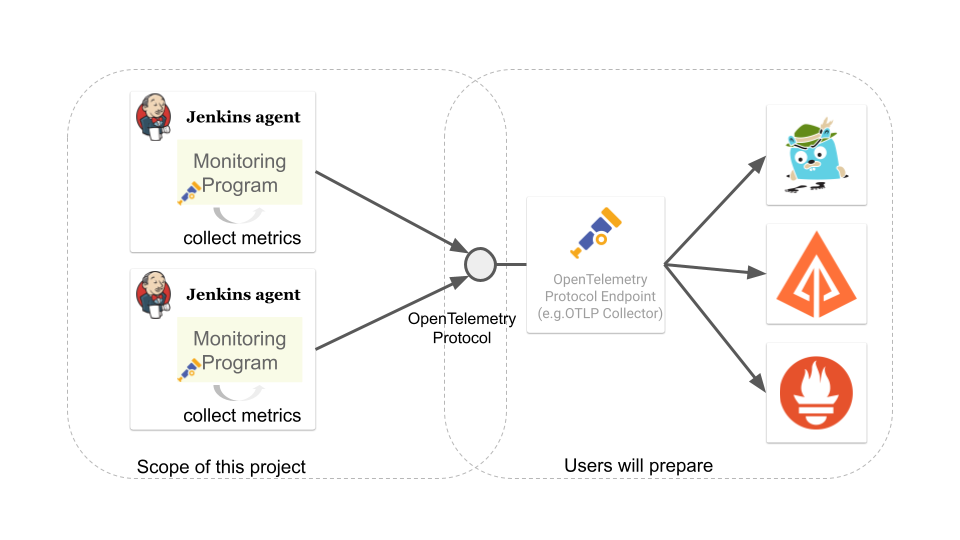
The goal of this project:
-
collect telemetry data(metrics, traces, logs) of remoting module with OpenTelemetry.
-
send the telemetry data to OpenTelemetry Protocol endpoint
Which OpenTelemetry endpoint to use and how to visualize the data are up to users. Collect telemetry data of Jenkins Remoting using OpenTelemetry.
An observability framework for cloud-native software
OpenTelemetry is a collection of tools, APIs, and SDKs. You can use it to instrument, generate, collect, and export telemetry data(metrics, logs, and traces) for analysis in order to understand your software’s performance and behavior.
We prepare docker-compose.yaml to set up them. Use it if you just want to try.
Clone repository from https://github.com/jenkinsci/remoting-opentelemetry-plugin.
$ cd example
$ docker-compose up
This will set up
-
OpenTelemetry Collector
-
Loki for Log aggregation
-
Prometheus for metric backend
-
Grafana for log and metric visualization
-
datasource is already configured
-
Download remoting-opentelemetry-engine-<tag>.jar from Release Page.
We will use this JAR as java agent when launching agent.
Use io.jenkins.plugins.remotingopentelemetry.engine.log.OpenTelemetryLogHandler for handler.
handlers=io.jenkins.plugins.remotingopentelemetry.engine.log.OpenTelemetryLogHandler,java.util.logging.ConsoleHandler
.level=INFOSetup jenkins controller and launch agent with -javaagent and -loggingConfig option.
$ export OTEL_EXPORTER_OTLP_ENDPOINT=http://localhost:55680
$ java \
-javaagent remoting-opentelemetry-engine.jar \
-jar agent.jar \
-jnlpUrl <jnlp url> \
-loggingConfig logging.propertiesOpen Grafana: http://localhost:3000/explore
We can configure the monitoring engine via environment variables.
| environment variable | require | example / description |
|---|---|---|
OTEL_EXPORTER_OTLP_ENDPOINT |
true |
|
Target to which the exporter is going to send spans, metrics or logs. |
||
SERVICE_INSTANCE_ID |
false |
90caeb02-a5ba-4827-bb3e-63babecfa893 |
The string ID of the service instance. If not provided, UUID will be generated and used every time the agent launches. |
||
REMOTING_OTEL_METRIC_FILTER |
false |
"system\.cpu\..*" |
Set regex filter for metrics. The metrics whose name match the regex will be collected. The default value is ".*" and collect all the metrics. |
Following resource attributes will be provided.
| key | value | description |
|---|---|---|
service_namespace |
"jenkins" |
This value will be configurable in the future. |
service_namespace |
"jenkins-agent" |
This value will be configurable in the future. |
service_instance_id |
Node name |
Only logs emitted via java.util.logging will be collected for now.
Following attributes will be provided.
| key | example | description |
|---|---|---|
log.level |
INFO |
Log level name. See |
code.namespace |
hudson.remoting.jnlp.Main$CuiListener |
The name of the class that (allegedly) issued the logging request. |
code.function |
status |
The name of the method that (allegedly) issued the logging request. |
exception.type |
java.io.IOException |
The class name of the throwable associated with the log record. |
exception.message |
Broken pipe |
The detail message string of the throwable associated with the log record. |
exception.stacktrace |
java.io.IOException: Broken pipe at hudson.remoting.Engine.innerRun(Engine.java:784) at hudson.remoting.Engine.run(Engine.java:575) |
The stacktrace the throwable associated with the log record. |
Following metrics will be collected.
metrics |
unit |
label key |
label value |
description |
system.cpu.load |
1 |
System CPU load. See |
||
system.cpu.load.average.1m |
System CPU load average 1 minute See |
|||
system.memory.usage |
byte |
state |
|
see |
system.memory.utilization |
1 |
System memory utilization,
see |
||
system.paging.usage |
byte |
state |
|
see |
system.paging.utilization |
1 |
see |
||
system.filesystem.usage |
byte |
device |
(identifier) |
System level filesystem usage. Linux only (get mount data from /proc/mounts). |
state |
|
|||
type |
|
|||
mode |
|
|||
mountpoint |
(path) |
|||
system.filesystem.utilization |
1 |
device |
(identifier) |
System level filesystem utilization (0.0 to 1.0). Linux only (get mount data from /proc/mounts). |
state |
|
|||
type |
|
|||
mode |
|
|||
mountpoint |
(path) |
|||
process.cpu.load |
% |
Process CPU load. See |
||
process.cpu.time |
ns |
Process CPU time. See |
||
runtime.jvm.memory.area |
bytes |
type |
|
see MemoryUsage |
area |
|
|||
runtime.jvm.memory.pool |
bytes |
type |
|
see MemoryUsage |
pool |
|
|||
runtime.jvm.gc.time |
ms |
gc |
|
|
runtime.jvm.gc.count |
1 |
gc |
|
Refer to our contribution guidelines.
Licensed under MIT, see LICENSE


