In this project combines all the skills learned in the Udacity's Cloud DevOps nanodegree program to build an automated CI-CD pipeline that deploys a Python application into a Kubernetes cluster hosted with AWS EKS.
Every code change pushed into this repository is validated by a Jenkins pipeline.
The master branch is considered the desired state of the deployed application and as soon as all validation steps
are a pass, the application is deployed into the Kubernetes cluster in a Blue-Green fashion.
Below are the stages the application has to pass that lead to a successful deployment:
- Static code validation (linting): python, html and Dockerfiles
- Build and unit testing run
- Docker container build
- Container scan for vulnerabilities
- Integration testing
When all the checks above complete successfully for the master branch, the container is promoted to release candidate
and a deployment is attempted:
- Push container to Docker registry
- Create a blue or green deployment in Kubernetes
- Smoke testing to validate and warm up the new deployment
- Promote successful release
- Tag new container as latest in DockerHub
The application is a simple API written in Python that translates date references expressed in natural language to
a exact date-time values. A user can make a POST request to the /translate endpoint and request to translate, say
in three days, and receive in response a date time value for that expression
Request: POST http://{{application_url}}/translate:
{
    "text": "in three days"
}
Response body:
{
    "result": "2020-04-13 12:39"
}
The application is hosted in a Kubernetes cluster designed for high availability. The cluster has three nodes hosted in EC2 instances covering different AZs (Availability Zones) in the AWS VPC.
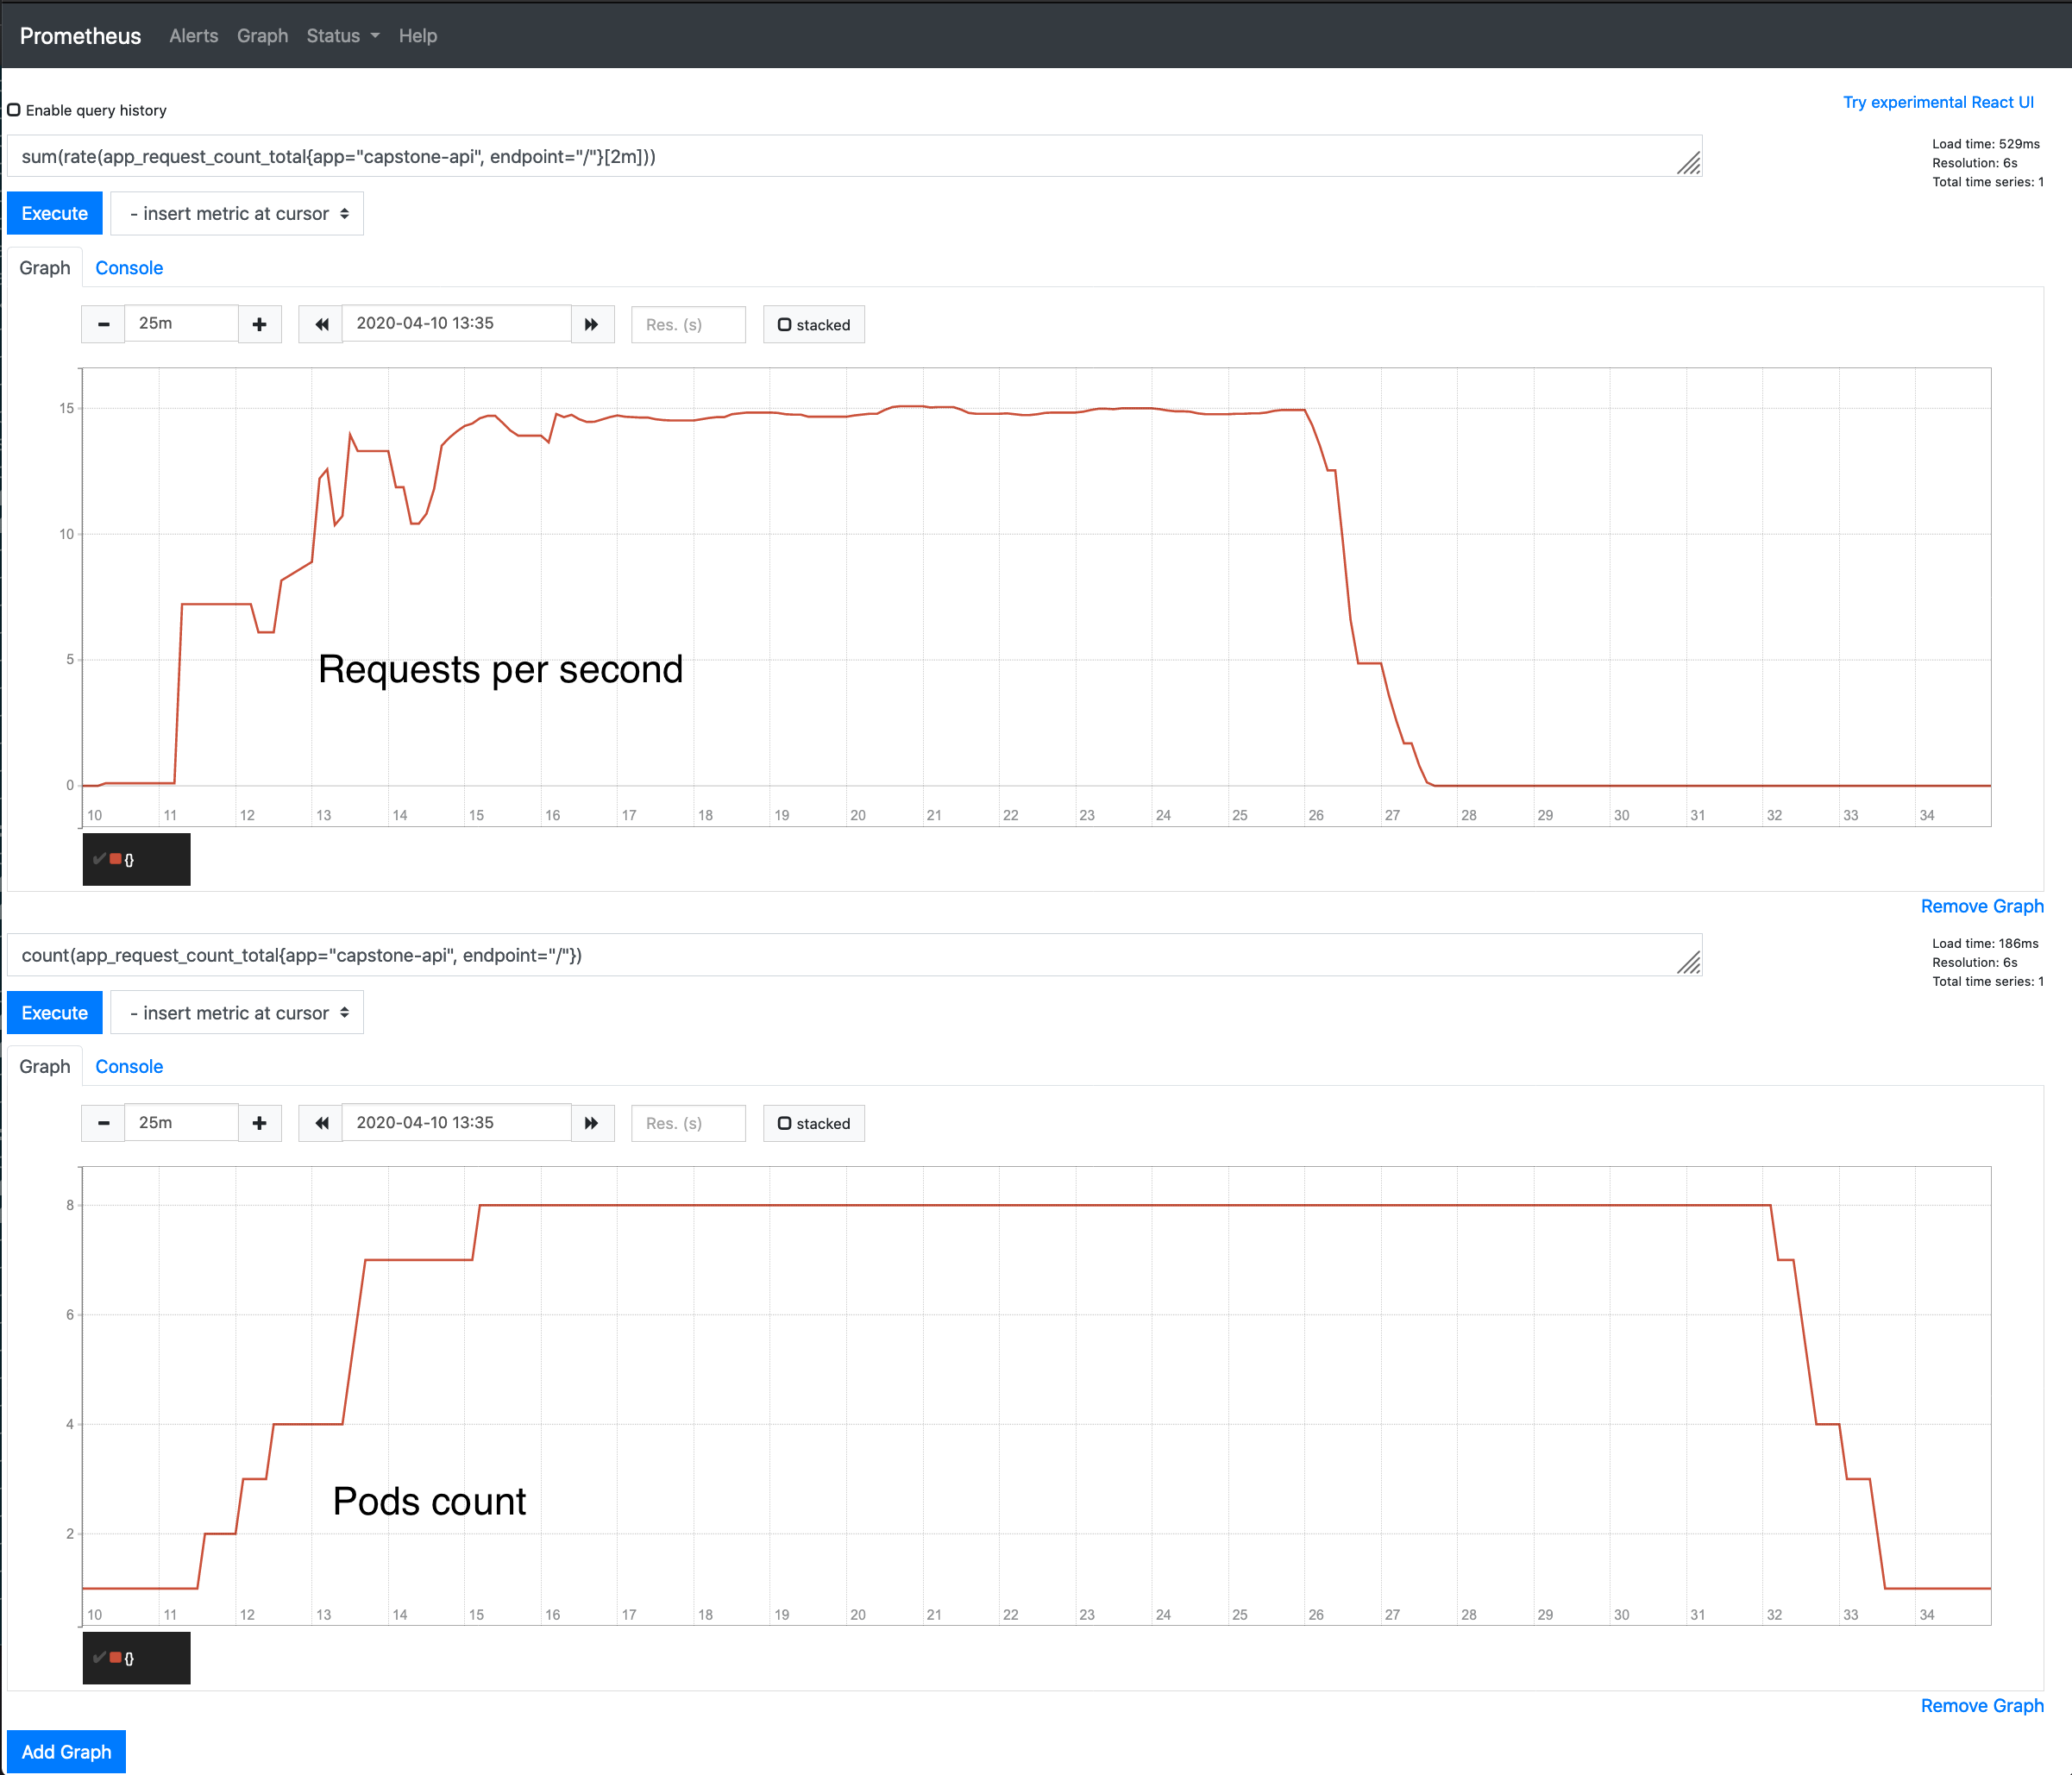
By running the application with the Kubernetes orchestrator we can take advantage of its autoscaling capabilities. The application is configured to autoscale based on throughput so that every node maintain optimal level of load and request throughput. For this project submission, the application has been configured so that every pod in the cluster handles an average of 2 requests per second.
The Kubernetes cluster is configured with a Prometheus server and the custom metrics adapter to collect throughput metrics from the application
by querying the /metrics endpoint. Kubernetes will query the pods/app_request_count_total from the custom metric API and control the number of
pod replicas so that every pod will manage the target 2 requests per second.
Below an example of a load run with Locust
The application is deployed using automated build steps from a Continuous Integration server that has been granted minimun permissions to all the managed resources without using root accounts:
- connects to DockerHub with access token to push new images to the repo
kubectaccess the Kubernetes API endpoint with a service account with limited namespace access- access to EC2 instances is limited using AWS SecurityGroups
The date translation application is deployed by a CI/CD pipeline with Jenkins CI. The pipeline is divided in the following sections:
- Static code checks and unit testing
- Application containerization and security scan
- Testing
- Blue-Green deployment in Kubernetes
- Post-release validation
- Promote release or rollback
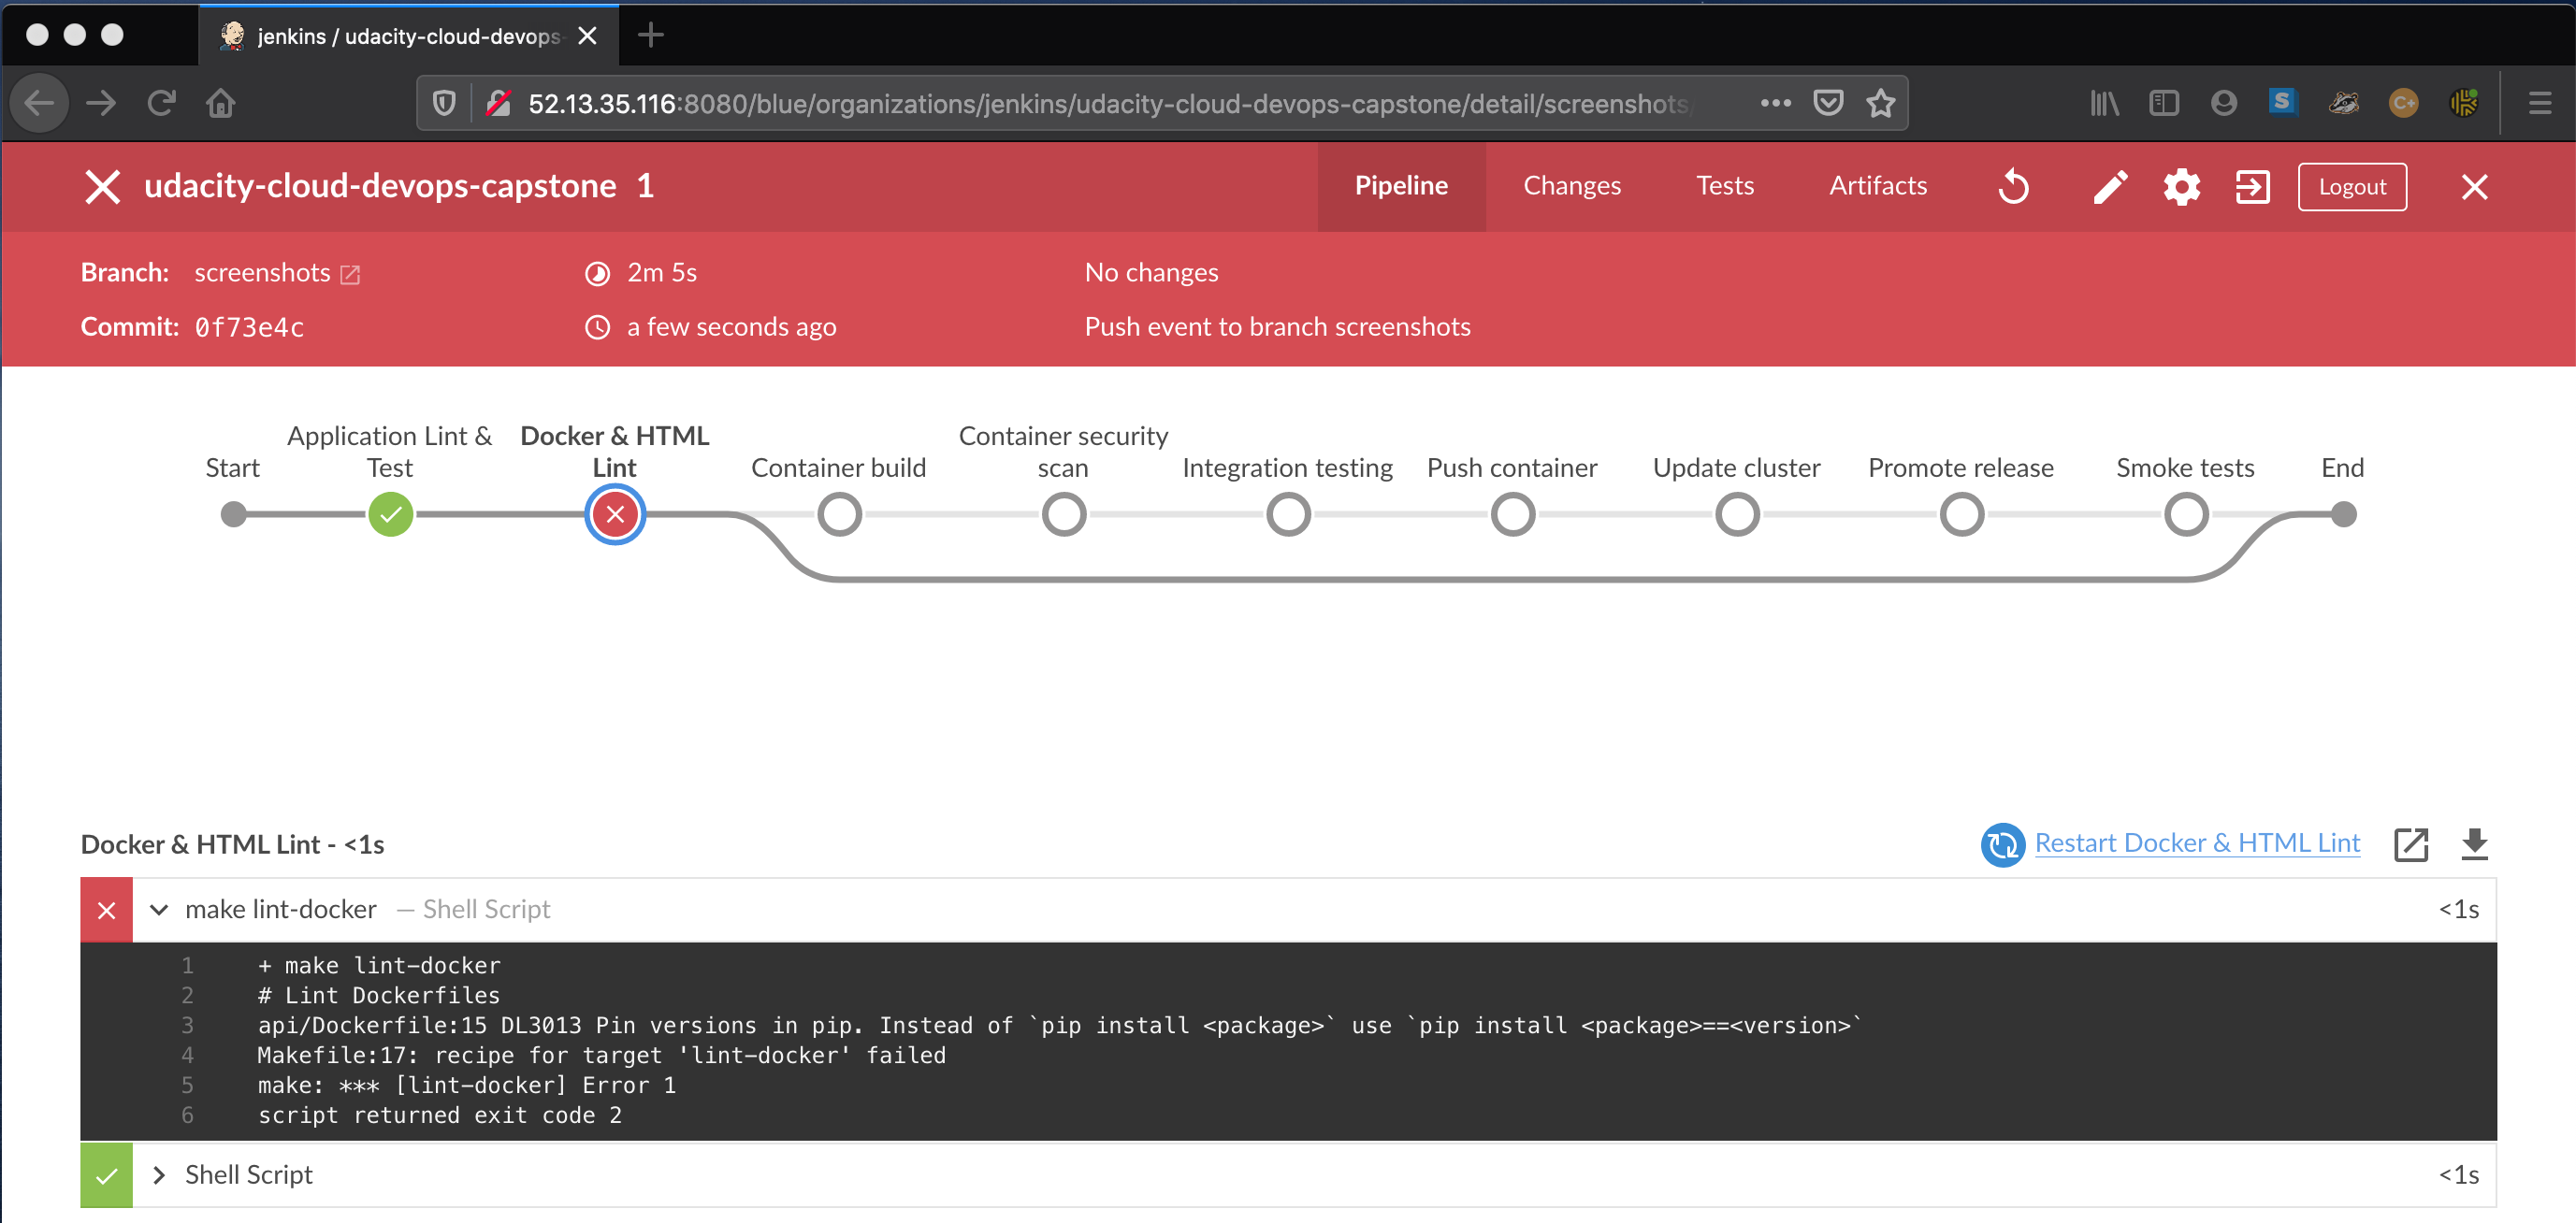
The first phase of the pipeline consists in performing a static code analysis for all the project files. The validation is performed for all commits push into this GitHub repository. All static analysis steps of the pipeline must pass or otherwise the build fails. See example:
Here is a list of the validations performed by the build:
- Python application linting (
pylint) - HTML linting with
tidy - Dockerfile linting with
hadolint - Python unit testing (
pytest)
After the linting phase, the application container is created form the api/Dockerfile. If the build branch is master
the generated docker image is also pushed into the DockerHub registry mcastellin/udacity-capstone-api
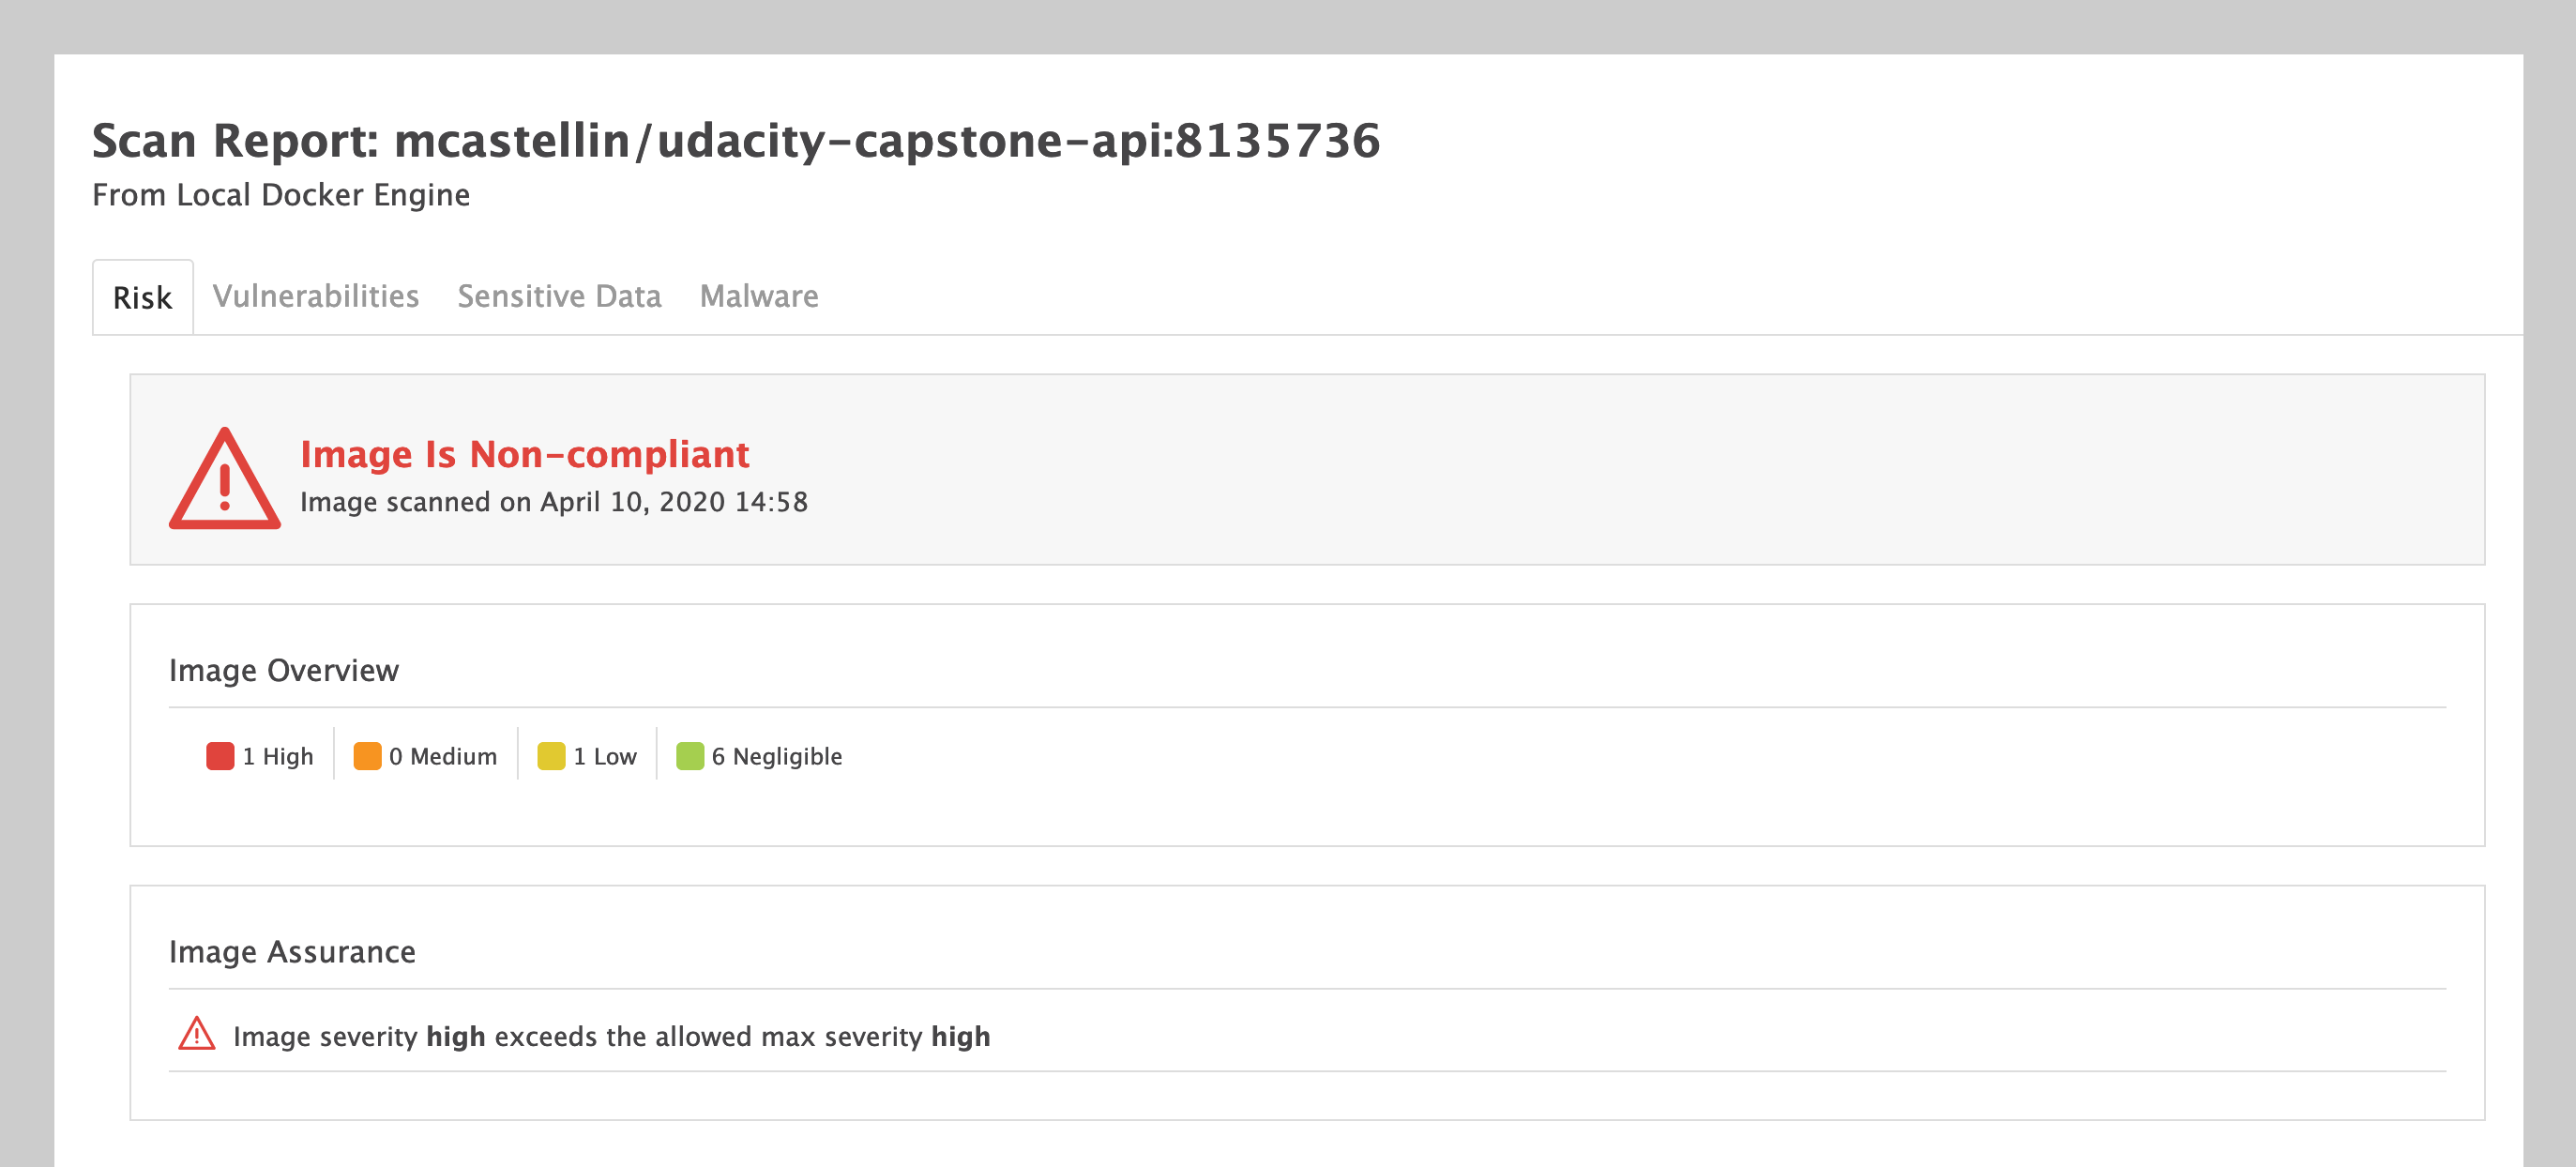
As part of the docker build, a security scan is performed on the image just generated using Aqua Microscanner. Below an example of the scanner detecting security issues for the docker image
A simple integration test is performed against a running container to verify the dockerized application can run and respond to simple requests.
The application is very simple so this validation is performed with a few curl commands
The application is deployed into a Kubernetes cluster hosted with Amazon EKS. The deployment is performed in a Blue-Green fashion. While the pipeline is running, two deployment of the api application exists in the cluster. Once the new application version is deployed and the validation is successful, we use Kubernetes pod labels to expose it:
kubectl set selector service/capstone-api-svc release=${nextCandidate},app=capstone-api -n default
The command above tells the capstone-api-svc service to route the incoming traffic to the pods of the new release candidate (blue or green)
How does the pipeline knows the new api is ready to serve requests?
The Kubernetes deployment runs liveness probes for all pods to check if the container is responsive before setting the pod status to
Ready. The date translation api exposes a/healthendpoint that responds with a HTTP 200 when the application is live.
# Application liveness probe configured for all pods
# it runs an HTTP get every 5 secods to check if the container
# is live and ready to serve requests
livenessProbe:
  httpGet:
    path: /health
    port: 8080
  initialDelaySeconds: 10
  periodSeconds: 5
  failureThreshold: 3
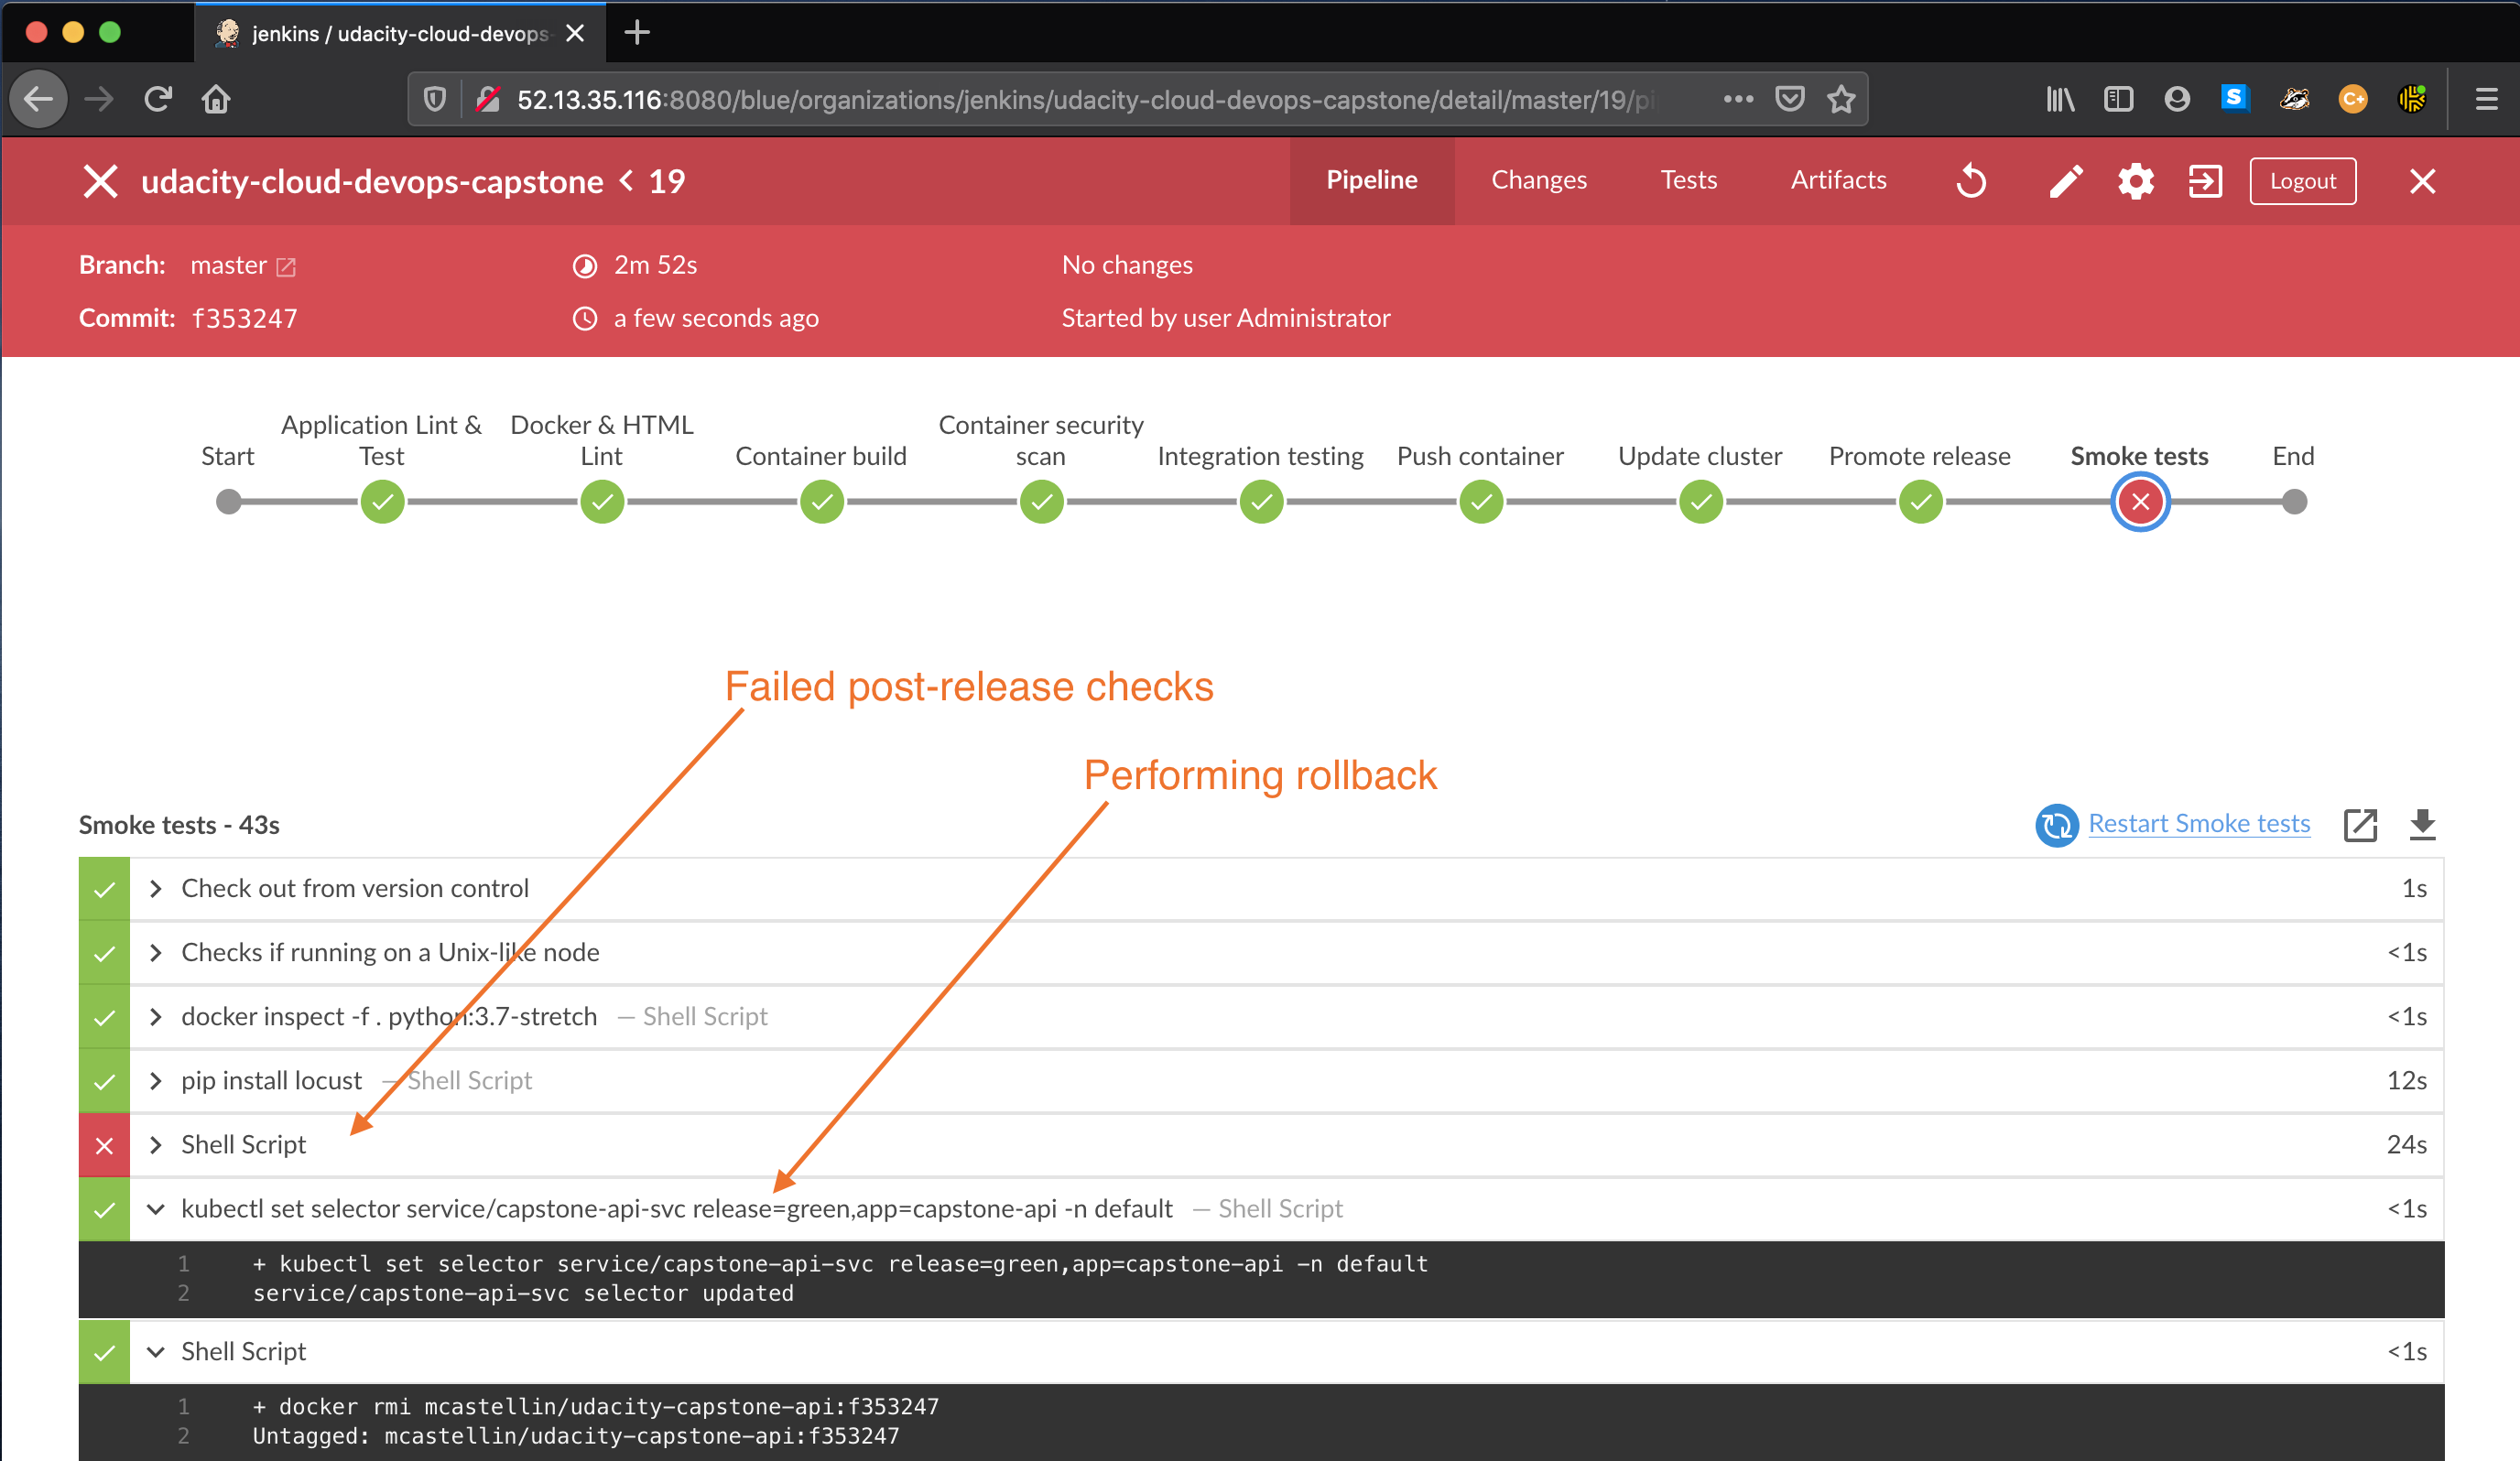
A post-reelase validation step (smoke testing) is performed right after a successful deployment. This steps uses Locust to validate the application is responsive and can handle a certain amount of requests without failure.
If a deployment testing is unsuccessful, the pipeline will immediately re-route the traffic back to the previous deployment, which is still available in the Kubernetes cluster.
- Install Jenkins instance with Cloudformation
- Install additional Jenkins plugins with ansible
- Create Kubernetes cluster in EKS
To deploy a Jenkins CI server on AWS use the cloudformation deployment script in the cloudformation/ directory
cd cloudformation/
./deploy_stack.sh infrastructure infrastructure.yaml
./deploy_stack.sh jenkins jenkins-ec2-pub1.yaml
Once the script is successful some useful information are exported in the stack output section in AWS Cloudformation console:
- command to SSH into the Jenkins instance
- command to retrieve the initial Jenkins admin password
- Jenkins CI console URL
After an admin account is configured for Jenkins, install additional plugins and packages into the bulid server by using the ansible/jenkins/install_plugins.yml Ansible playbook:
cd ansible/
ansible-playbook --key-file=~/.ssh/pipeline.pem -u ubuntu \
    -i "<jenkins_ip>," \
    -e jenkins_user=<admin_username> -e jenkins_password=<admin_password> \
    jenkins/install_plugins.yml
From Jenkins BlueOcean follow these steps to configure a new multi-branch pipeline with web-hooks
- from BlueOcean Jenkins page, click the Create Pipeline button
- select Github and create the access token as instructed
- select your repository and confirm
- navigate the Settings menu for your GitHub repository
- under Webhooks select Add webhook
- specify your Jenkins server URL like, for instance
http://<jenkins_ip>:8080/github-webhook/ - specify a content-type and secret (optional)
- select the Just the push event and create the webhook
In order to run the pipeline we need a working Kubernetes cluster. The cloudformation/ directory contains the cloudformation files and
utility scripts to take care of the cluster creation in AWS EKS.
To install a new cluster run the following:
cd cloudformation/
./create_cluster.sh
The setup script will deploy a cloudformation stack on top of the network infrastructure created before.
- A EKS Control Panel
- EKS NodeGroups to use as worker nodes
Once the stack creation is completed, the cluster creation script will also
- Create a new Kubernetes service account
jenkins-capstonefor Jenkins to perform releases - Install
nginx-ingresscontroller,metrics-server,prometheus,prometheus-adapter - Deploy the our application service ingress
- Create the Kubernetes service account for Jenkins
- Fetch and print Kubernetes console API url and the cluster public DNS name
This project is released under the MIT License


