Table of Contents
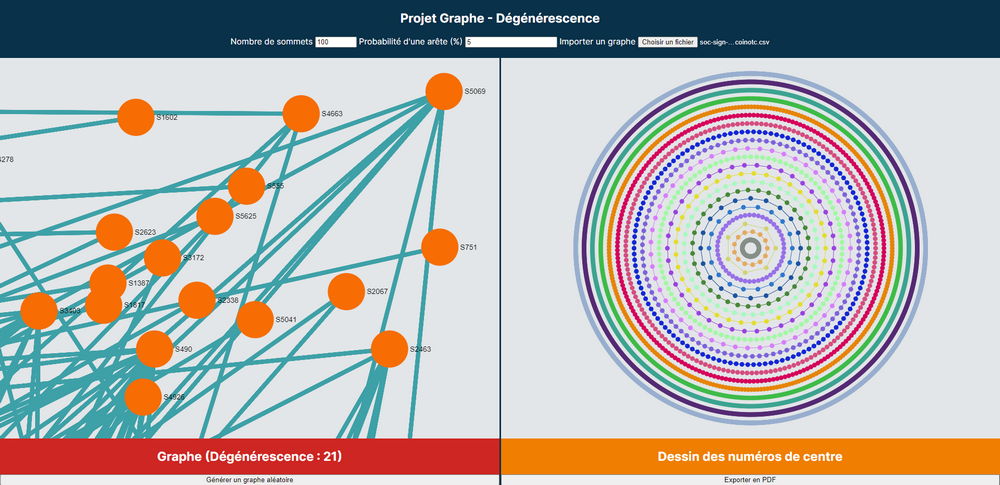
This project is a small application to compute and visually represent the degeneracy of large graphs.
- Randomly generate graphs of varying order and size.
- Import graphs.
- Calculation of the degeneracy.
- Visual and interactive representation of graphs.
- Visual representation of k-cores.
- Export to PDF the graph visualization.
This project is an academic project made during the third year of a Bachelor of Computer Science.
The development was done by 2 people.
JavaScript libraries:
You can find documentation files such as technical details in the folder docs/.
The file is a text file containing for each line, a pair of node numbers, the first node is the start of an edge and the second node is the destination of an edge.
- If the file is a
.txt, then the nodes are separated by a space or a tab. - If the file is a
.csv, then the nodes are separated by a comma.
Show an example of a text file
# A tree, depth 2.
1 2
1 3
2 1
2 4
2 5
3 1
3 6
4 2
5 2
6 3
Show an example of a CSV file
# 3-vertex clique.
1,2
2,1
2,3
3,1
3,2
To get a local copy up and running, just open src/index.html in your favorite browser.
You can find some graph samples to import in the folder samples/, otherwise, you can download more on SNAP for example.
This project was made by:
- Stanford Network Analysis Project for graph samples.