A repository for the course material used in a Data plus project training at Duke, which focus on visualization in python. Materials are free to use under MIT Liscence.
-
Session 1 Programming Basics:
-
Session 2: Data Acquisition
-
HTML CSS Javascript Basics; How browser renders web content? Things covered in the example scrapping
-
Beautiful soup: How it Cleans the HTML tags and Structurize the document
-
Basics about the CSS selector
-
How to srape html table
-
Using Selenium for scraping in more complex scenarios
-
-
Session 3: Data Exploration
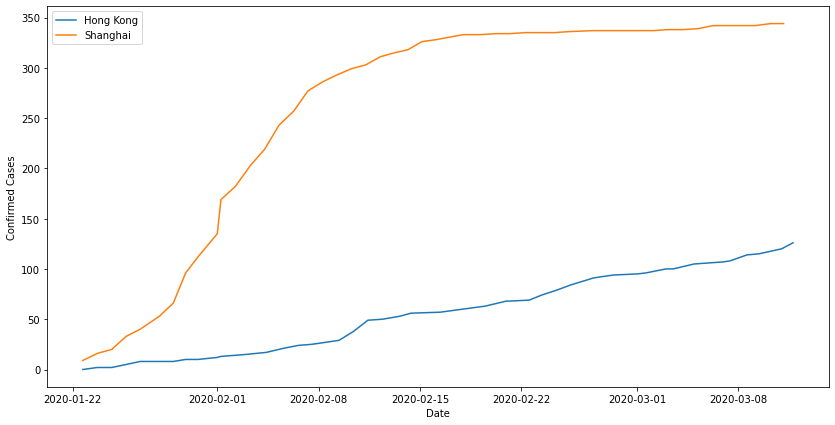
- Histogram Barchat, Time data formatting used in visualization (One Staition 20 days, line oscilations, inject scattering missing data, create some illegal data)
-
- Load the file and count the nas of each variables (Exercise)
-
- Illegally values (Exercise)
- Grouping using time hours into days, days into months
-
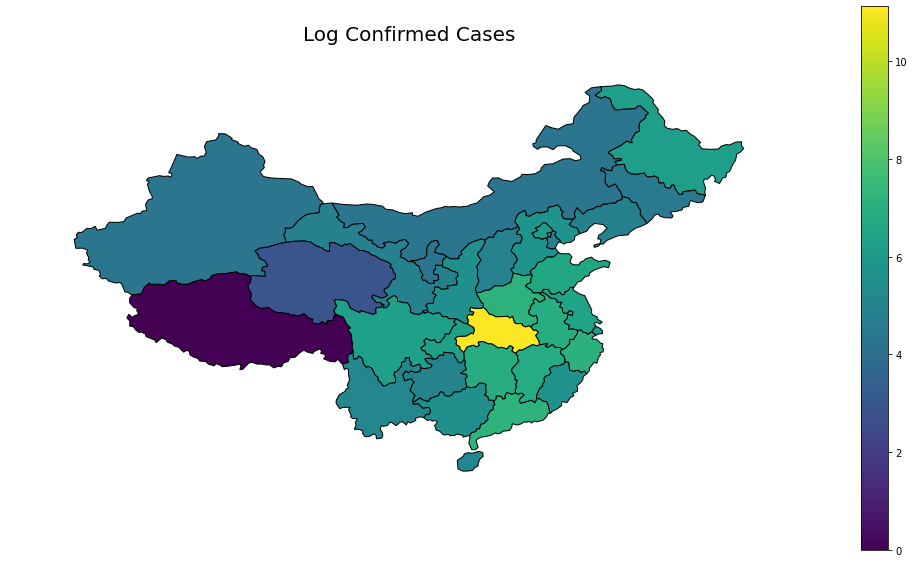
Session 4: Geographical Visualization
-
Session 5: Machine Learning
- Big categories of Machine Learning: Supervised/Unsupervised/Semi-Supervised
- Maximum Likelihood and loss function
- Random Forest, Naive Bayes, Linear Discriminent Analysis, SVM
- Linear, Polynomial Regression, Non Parametric Regression, Gaussian Process Regression


