This is an application for collecting sensor measurements from Xiaomi Mijia bluetooth temperature/humidity sensor.
It’s based on reading output of hcidump tool and passive scanning of BLE devices with hcitool tool.
The description of a protocol used by the sensor is described at the following link:
https://github.com/mspider65/Xiaomi-Mijia-Bluetooth-Temperature-and-Humidity-Sensor/blob/master/SensorProtocol.html
-
Start scanning for BLE devices in passive mode
hciconfig hci0 up
hcitool lescan --passive --duplicates
TipThe
hcitool lescancommand may fail with various errors, for example:Set scan parameters failed: Input/output errorYou may try to fix it with
hciconfig hci0 resetorrfkill unblock bluetooth. -
Start the collector specifying MAC address(es) of sensors to monitor
hcidump -R | ./xiaomi-mijia-bluetooth-sensor 582D3430247C 362D34303089 ...The following is example output:
{"time":"2020-05-21T06:51:24.450Z","humidity":34.3,"temperature":22.1,"mac":"582D3430247C"}
{"time":"2020-05-21T06:51:26.447Z","temperature":22.1,"mac":"582D3430247C"}
{"time":"2020-05-21T06:51:28.454Z","humidity":34.2,"temperature":22.1,"mac":"582D3430247C"}
{"time":"2020-05-21T06:51:34.465Z","humidity":34.1,"temperature":22.0,"mac":"582D3430247C"}
{"time":"2020-05-21T06:51:36.465Z","humidity":34.0,"mac":"582D3430247C"}
{"time":"2020-05-21T06:51:38.467Z","batteryLevel":31.0,"mac":"582D3430247C"}
{"time":"2020-05-21T06:51:40.475Z","humidity":34.2,"temperature":22.0,"mac":"582D3430247C"}
{"time":"2020-05-21T06:51:42.483Z","humidity":34.1,"temperature":22.0,"mac":"582D3430247C"}
{"time":"2020-05-21T06:51:44.481Z","humidity":34.1,"temperature":22.1,"mac":"582D3430247C"}
-
Start collecting data from a sensor dumping measurements into file
hcidump -R | ./xiaomi-mijia-bluetooth-sensor 582D3430247C 362D34303089 ... | tee -a /tmp/metrics.json -
Start several docker containers with docker-compose that will run instances of: Telegraf, InfluxDB and Grafana.
SENSOR_METRICS_FILE_PATH=/tmp/metrics.json docker-compose up
NoteSENSOR_METRICS_FILE_PATHshould point to the file where metrics from the application are dumped. This is the file which will be tailed by Telegrag. -
In Grafana, add a datasource of type InfluxDB pointing to database created by telegraf
-
Import the dashboard: grafana-dashbpard.json or just use
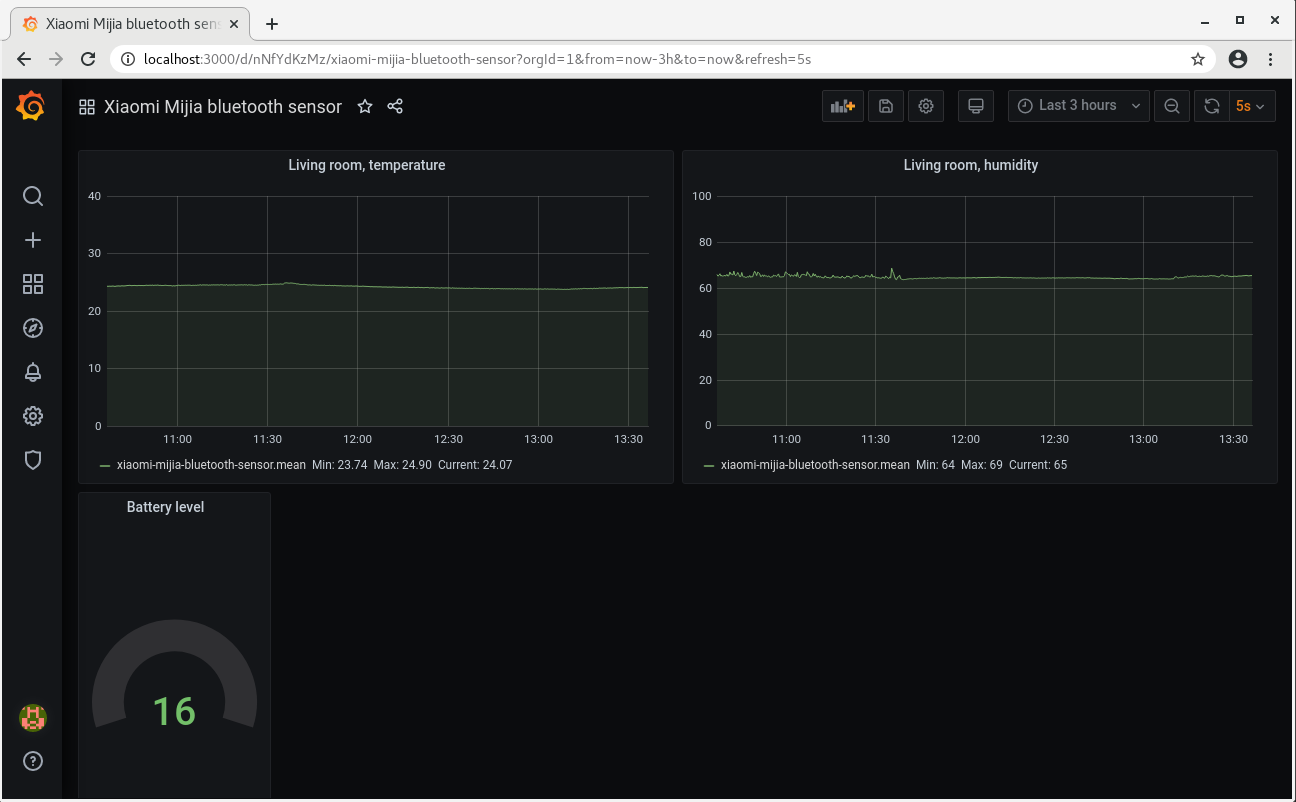
Exploreto monitor temperature measurements:Data Source: InfluxDB From: defaul xiaomi-mijia-bluetooth-sensor Select: field(temperature) mean() Group By: time($_interval) fill(null) Format as: Time series. -
Leave things working for several hours
-
After several hours you should observe graph(s) full of data