#LeakCanary
A memory leak detection library for Android and Java.
“A small leak will sink a great ship.” - Benjamin Franklin
In your build.gradle:
 dependencies {
   debugCompile 'com.squareup.leakcanary:leakcanary-android:1.3'
   releaseCompile 'com.squareup.leakcanary:leakcanary-android-no-op:1.3'
 }
In your Application class:
public class ExampleApplication extends Application {

  @Override public void onCreate() {
    super.onCreate();
    LeakCanary.install(this);
  }
}
You're good to go! LeakCanary will automatically show a notification when an activity memory leak is detected in your debug build.
Glad you ask! We wrote a blog post to answer precisely that question.
Use a RefWatcher to watch references that should be GCed:
RefWatcher refWatcher = {...};

// We expect schrodingerCat to be gone soon (or not), let's watch it.
refWatcher.watch(schrodingerCat);
LeakCanary.install() returns a pre configured RefWatcher.
It also installs an ActivityRefWatcher that automatically detects if an activity is leaking after Activity.onDestroy() has been called.
public class ExampleApplication extends Application {

  public static RefWatcher getRefWatcher(Context context) {
    ExampleApplication application = (ExampleApplication) context.getApplicationContext();
    return application.refWatcher;
  }

  private RefWatcher refWatcher;

  @Override public void onCreate() {
    super.onCreate();
    refWatcher = LeakCanary.install(this);
  }
}
You could use the RefWatcher to watch for fragment leaks:
public abstract class BaseFragment extends Fragment {

  @Override public void onDestroy() {
    super.onDestroy();
    RefWatcher refWatcher = ExampleApplication.getRefWatcher(getActivity());
    refWatcher.watch(this);
  }
}RefWatcher.watch()creates a KeyedWeakReference to the watched object.- Later, in a background thread, it checks if the reference has been cleared and if not it triggers a GC.
- If the reference is still not cleared, it them dumps the heap into a
.hproffile stored on the app file system. HeapAnalyzerServiceis started in a separate process andHeapAnalyzerparses the heap dump using HAHA.HeapAnalyzerfinds theKeyedWeakReferencein the heap dump thanks to a unique reference key and locates the leaking reference.HeapAnalyzercomputes the shortest strong reference path to the GC Roots to determine if there is a leak, and then builds the chain of references causing the leak.- The result is passed back to
DisplayLeakServicein the app process, and the leak notification is shown.
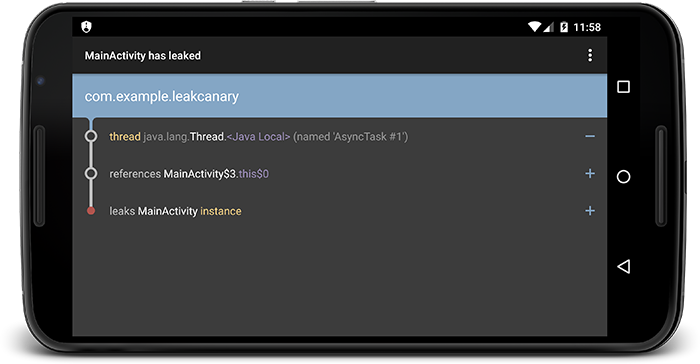
You can see the leak trace in Logcat:
In com.example.leakcanary:1.0:1 com.example.leakcanary.MainActivity has leaked:
* GC ROOT thread java.lang.Thread.<Java Local> (named 'AsyncTask #1')
* references com.example.leakcanary.MainActivity$3.this$0 (anonymous class extends android.os.AsyncTask)
* leaks com.example.leakcanary.MainActivity instance

* Reference Key: e71f3bf5-d786-4145-8539-584afaecad1d
* Device: Genymotion generic Google Nexus 6 - 5.1.0 - API 22 - 1440x2560 vbox86p
* Android Version: 5.1 API: 22
* Durations: watch=5086ms, gc=110ms, heap dump=435ms, analysis=2086ms
You can also share the leak trace and the heap dump file from the action bar menu.
There are a number of known memory leaks that have been fixed over time in AOSP as well as in manufacturer implementations. When such a leak occurs, there is little you can do as an app developer to fix it. For that reason, LeakCanary has a built-in list of known Android leaks to ignore: AndroidExcludedRefs.java. If you find a new one, please create an issue with the leak trace, the reference key, the device and the Android version. It's even better if you provide a link to a heap dump file.
This is especially important for new releases of Android. You have the opportunity to help detect new memory leaks early on, which could benefit the entire Android community.
Snapshots of the development version are available in Sonatype's snapshots repository.
Sometimes the leak trace isn't enough and you need to dig into the heap dump with MAT or YourKit. Here's how you can find the leaking instance in the head dump:
- Look for all instances of
com.squareup.leakcanary.KeyedWeakReference - For each of these, look at the
keyfield. - Find the
KeyedWeakReferencethat has akeyfield equal to the reference key reported by LeakCanary. - The
referentfield of thatKeyedWeakReferenceis your leaking object. - From then on, the matter is in your hands. A good start is to look at the shortest path to GC Roots (excluding weak references).
DisplayLeakActivity comes with a default icon and label, which you can change by providing R.drawable.__leak_canary_icon and R.string.__leak_canary_display_activity_label in your app:
res/
  drawable-hdpi/
    __leak_canary_icon.png
  drawable-mdpi/
    __leak_canary_icon.png
  drawable-xhdpi/
    __leak_canary_icon.png
  drawable-xxhdpi/
    __leak_canary_icon.png
  drawable-xxxhdpi/
    __leak_canary_icon.png
<?xml version="1.0" encoding="utf-8"?>
<resources>
  <string name="__leak_canary_display_activity_label">MyLeaks</string>
</resources>DisplayLeakActivity saves up to 7 heap dumps & leak traces in the app directory. You can change that number by providing R.integer.__leak_canary_max_stored_leaks in your app:
<?xml version="1.0" encoding="utf-8"?>
<resources>
  <integer name="__leak_canary_max_stored_leaks">20</integer>
</resources>You can change the default behavior to upload the leak trace and heap dump to a server of your choosing.
Create your own AbstractAnalysisResultService. The easiest way is to extend DefaultAnalysisResultService in your debug sources:
public class LeakUploadService extends DefaultAnalysisResultService {
  @Override protected void afterDefaultHandling(HeapDump heapDump, AnalysisResult result, String leakInfo) {
    if (!result.leakFound || result.excludedLeak) {
      return;
    }
	myServer.uploadLeakBlocking(heapDump.heapDumpFile, leakInfo);
  }
}
Make sure the release Application class uses the disabled RefWatcher:
public class ExampleApplication extends Application {

  public static RefWatcher getRefWatcher(Context context) {
    ExampleApplication application = (ExampleApplication) context.getApplicationContext();
    return application.refWatcher;
  }

  private RefWatcher refWatcher;

  @Override public void onCreate() {
    super.onCreate();
    refWatcher = installLeakCanary();
  }

  protected RefWatcher installLeakCanary() {
    return RefWatcher.DISABLED;
  }
}
Build a custom RefWatcher in your debug Application class:
public class DebugExampleApplication extends ExampleApplication {
  protected RefWatcher installLeakCanary() {
    return LeakCanary.install(app, LeakUploadService.class);
  }
}
Don't forget to register the service in your debug manifest:
<?xml version="1.0" encoding="utf-8"?>
<manifest xmlns:android="http://schemas.android.com/apk/res/android"
    xmlns:tools="http://schemas.android.com/tools"
    >
  <application android:name="com.example.DebugExampleApplication">
    <service android:name="com.example.LeakUploadService" />
  </application>
</manifest>Copyright 2015 Square, Inc.
Licensed under the Apache License, Version 2.0 (the "License");
you may not use this file except in compliance with the License.
You may obtain a copy of the License at
http://www.apache.org/licenses/LICENSE-2.0
Unless required by applicable law or agreed to in writing, software
distributed under the License is distributed on an "AS IS" BASIS,
WITHOUT WARRANTIES OR CONDITIONS OF ANY KIND, either express or implied.
See the License for the specific language governing permissions and
limitations under the License.
