In the complex landscape of Apache Kafka ecosystems, monitoring data streams and detecting anomalies can be challenging. Kafka Kare addresses this challenge by offering a user-friendly interface to visualize Kafka topics, partitions, consumer groups, and more.
With built-in alerting mechanisms, it empowers users to proactively identify issues such as lagging consumers, high throughput, or unusual patterns, ensuring the reliability and performance of Kafka deployments.
Kafka Kare is an open-source web application designed to provide powerful visualization capabilities and real-time alerting functionalities for Apache Kafka environments. It offers seamless integration with Kafka clusters, allowing users to monitor data streams, visualize key metrics, and set up Slack alerts for critical events.
Kafka Kare is built with:
Kafka Kare's key features include:
- With its plug-and-play functionality, Kafka Kare allows users to add cluster connections with their port numbers.
- Once connected, real-time visualization of 22 key Kafka cluster metrics such as consumer lag, overall health of the cluster, and latency are available via Grafana-generated dashboards that are supported by Prometheus.
- Additionally, the alerting system allows users to define custom alert rules based on various Kafka metrics and thresholds. When predefined conditions are met, the system triggers alerts via Slack, enabling timely response to potential issues and ensuring the stability of Kafka infrastructures.
Read more about our build process on Medium, here!
- Fork and clone this repository then open it on your code editor of choice.
- If you don't have it installed already, please set up Docker. The Kafka Kare team uses Docker Desktop: https://www.docker.com/products/docker-desktop/
- To use Kafka Kare, you must have a containerized Kafka cluster set up to expose JMX data.
- You can use Confluent's Kafka images with the
KAFKA_OPTSenvironmental variable to run the Prometheus JMX Exporter as a Java agent. Your cluster should also be set up using a Docker bridge network to allow the Prometheus container to connect. See here for an example.
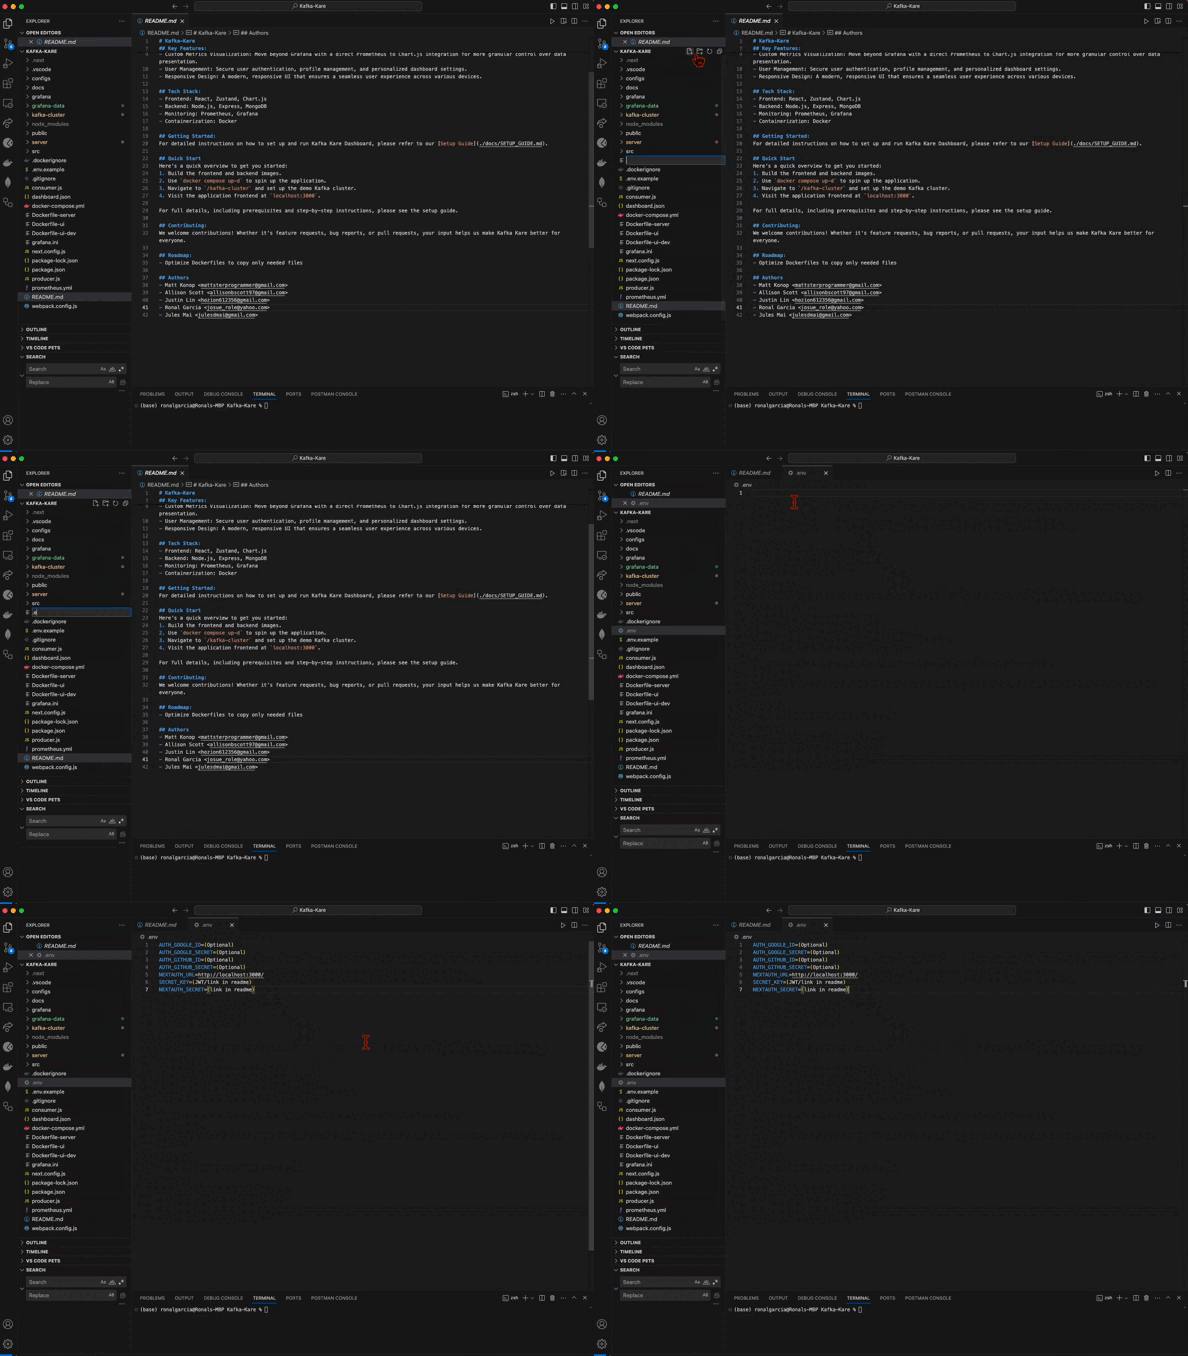
- Setup the .env file
- Locate the .env.example file in the root directory. You will need to add your own JSON Web Token (JWT) secret key for security purposes: https://jwt.io/
- You will also need to set up your own Next Auth URL and secret key for security purposes: https://next-auth.js.org/configuration/options
- Optional: If you would prefer to use Github or Google OAuth for your login, please fill in the corresponding ID and Secret Key in the .env file as well.
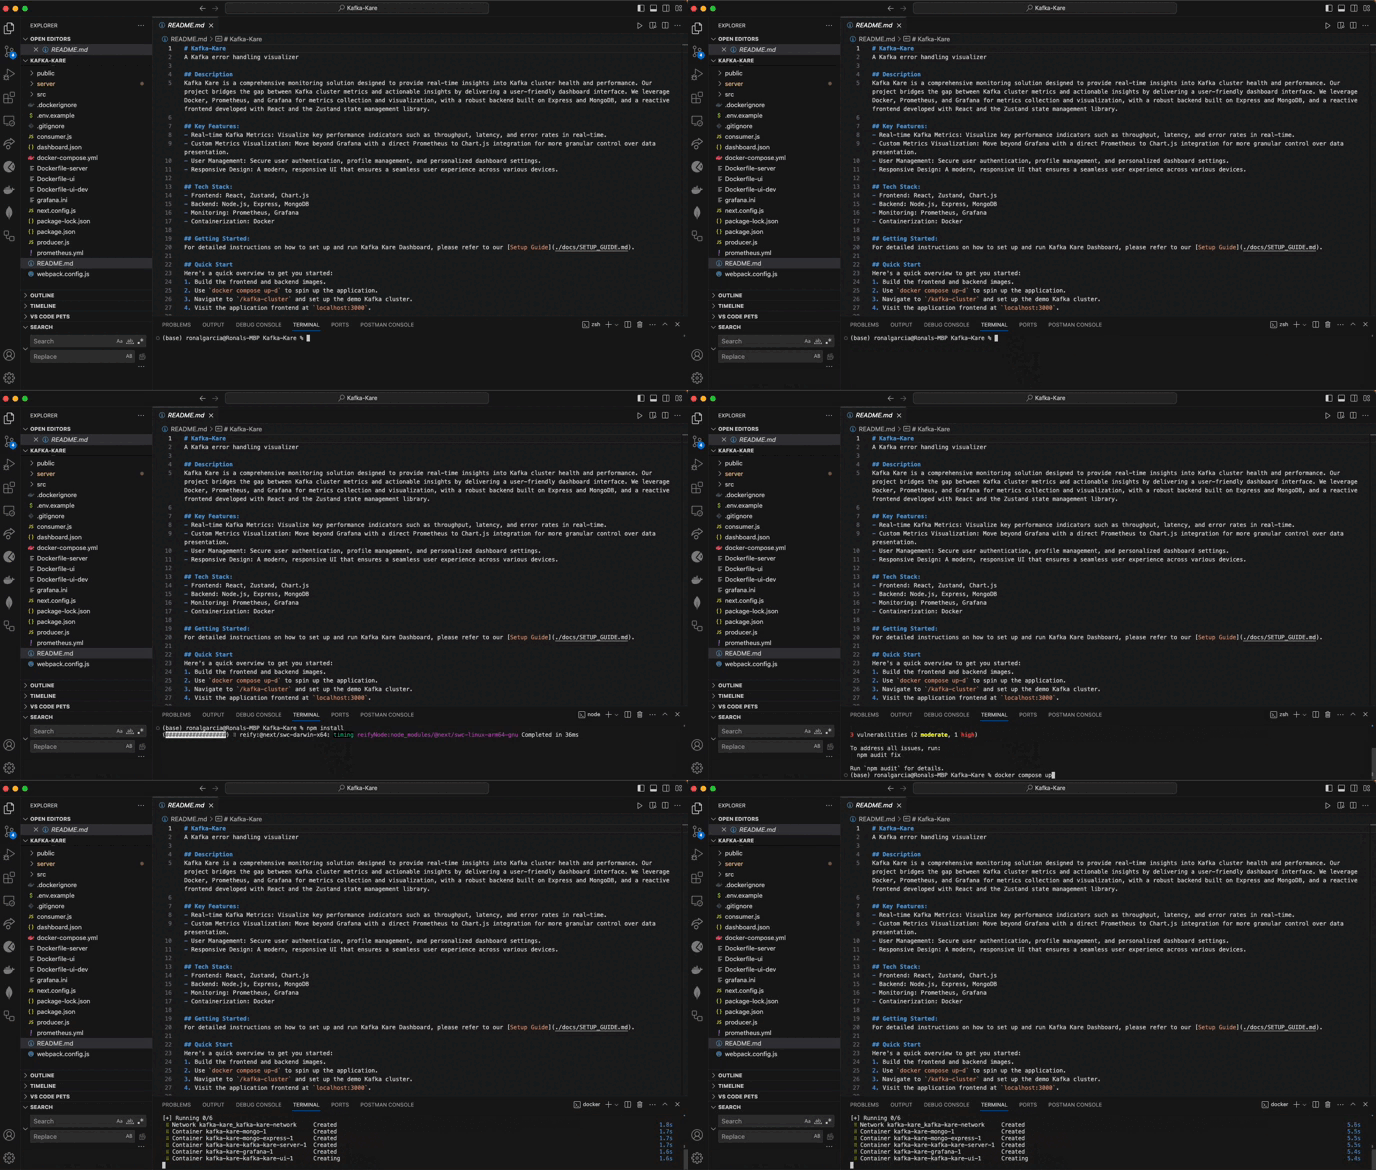
- Spin up the application container by running the below command:
docker compose up -d
1. Change directory to /kafka-cluster
cd kafka-cluster
2. (First time running the application) Build kafka cluster image
docker build -t dockerpromkafka:latest .
3. Spin up demo kafka-cluster container (demo Kafka-cluster container must be spun up after application container)
docker compose up -d
4. Run the consumer followed by producer script
node consumer.js
node producer.js
5. Congratulations! You just set up your first Kafka cluster!
- Visit localhost:3000, create an account or log in. Click the 'Add Cluster' button, enter in the port number of your cluster, then click the dashboard button to start viewing your metrics!
- Optional: Navigate to localhost:8080 to view your database. The username and password is located in the logs of the mongo-express container.
- Click the 3 lines to enter in your Slack URL and head to the Alerts page to configure your custom alerting thresholds.
- Enjoy!
- Spin down application container
docker compose down
- Change directory to /kafka-cluster
cd kafka-cluster
- Spin down demo kafka-cluster container
docker compose down
Now seeking contributors to join the Kafka Kare team!
To start contributing, please fork and clone Kafka Kare, create a feature branch with the pattern "(issue or feature)/what-you-are-working-on".
When you are ready to submit a pull request to the dev branch, please follow the checklist closely and request at least two people to review and approve your code. You can refer to the Kafka Kare team members here.
Prioritize any linked issues first before tackling the roadmap features and feel free to add any roadmap features as well that will continue to bring value to developers! We appreciate your support!
| Feature | Status |
|---|---|
| Ability to plug in Kafka cluster to app | ✅ |
| Metrics visualization with Grafana | ✅ |
| Save custom dashboard for users | ⏳ |
| Save historical data | ⏳ |
| Alert history | ⏳ |
| Custom notification configuration | 🙏🏻 |
| Migrate to KRaft | 🙏🏻 |
| Shared state between any component shortcode | 🙏🏻 |
- ✅ = Ready to use
- ⏳ = In progress
- 🙏🏻 = Looking for contributors

Allison Scott 🖇️ 🐙 |

Matt Konop 🖇️ 🐙 |

Justin Lin 🖇️ 🐙 |

Jules Mai 🖇️ 🐙 |

Ronal Garcia 🖇️ 🐙 |
- 🐙 = Github
This product is licensed under the MIT License without restriction.


