Chronic kidney disease (CKD) is common among adults in the United States. More than 37 million American adults may have CKD. CKD means your kidneys are damaged and can’t filter blood the way they should. The disease is called “chronic” because the damage to your kidneys happens slowly over a long period of time. This damage can cause wastes to build up in your body. CKD can also cause other health problems. The sooner you know you have kidney disease, the sooner you can make changes to protect your kidneys. We use logistic regression to predict the probability that the patient suffers from CKD.
As we implied in the abstract, our objective is to predict whether the patient suffers from ckd in time to save his life. We will be using logistic regression, which is the go-to linear classification algorithm for two-class problems.
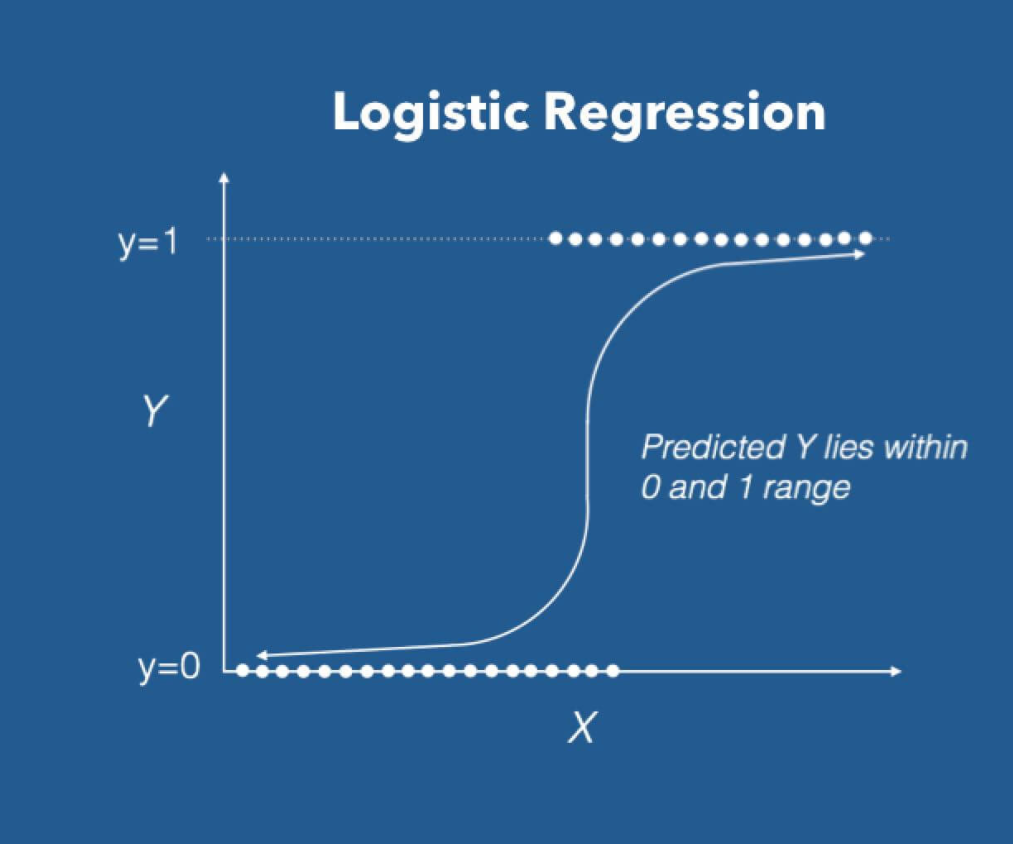
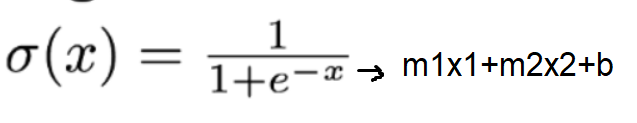
Logistic regression uses an equation as the representation, very much like linear regression. Input values (X) are combined linearly using weights or coefficient values to predict an output value (y).
A key difference from linear regression is that the output value being modeled is a binary value (0 or 1) rather than a numeric value.
In order to make our prediction we have to determine the value of each slope, we can do this using an efficient implementation of linear regression, named gradient descent.
Gradient descent update the parameters (slopes) by calculating over and over its values until the predicted value is the same as the real value, the error is less than the learning rate or the number or iterations reach a limit. In a nutshell, gradient descent does big steps when far way, and does baby steps when close to the optimal value.
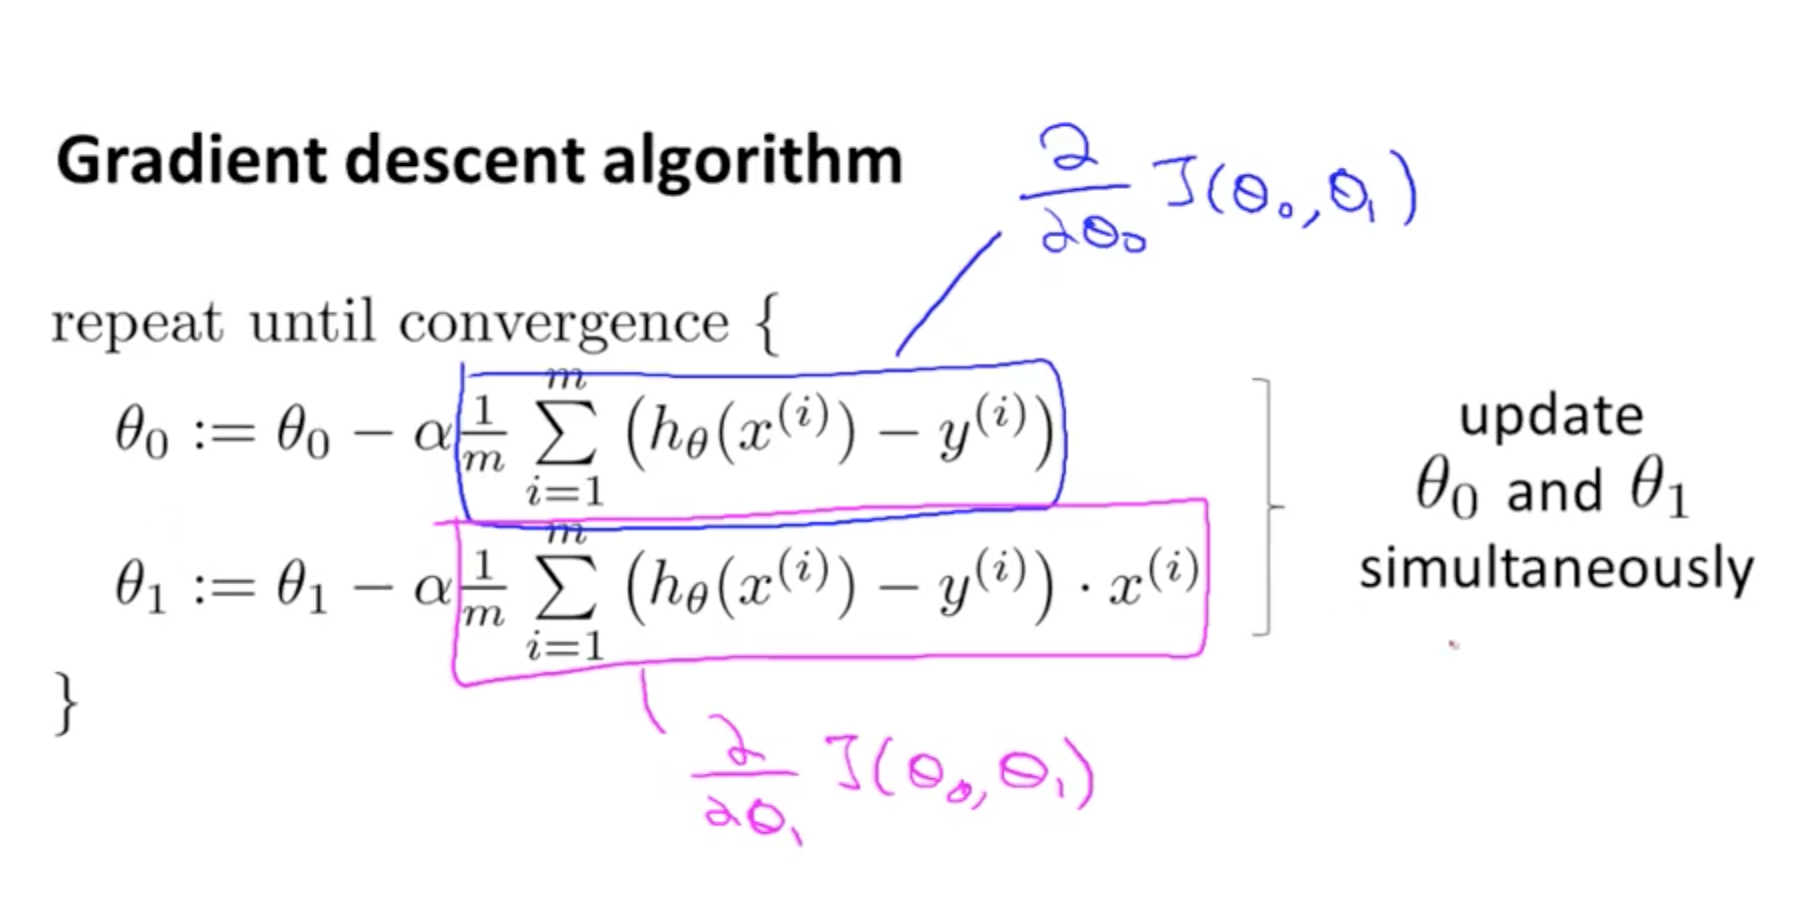
Where theta is each one of the parameters (theta 0 is the bias), alpha is the learning rate, m is the number of parameters, h0 is a prediction, y(i) is the real value and finally, xij is the value of the samples.
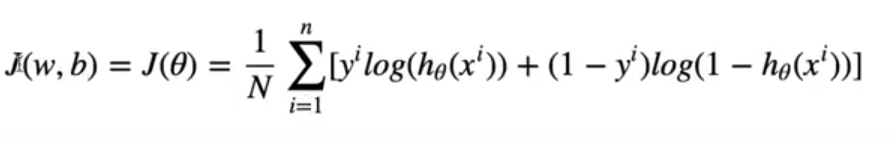
In order to calculate our error, in each epoch we will be using a loss function called cross entropy.
Finally the stature_hand_foot.csv dataset has the following features:
- Age(numerical) age in years
- Blood Pressure(numerical) bp in mm/Hg
- Specific Gravity(nominal) sg - (1.005,1.010,1.015,1.020,1.025)
- Albumin(nominal) al - (0,1,2,3,4,5)
- Sugar(nominal) su - (0,1,2,3,4,5)
- Red Blood Cells(nominal) rbc - (normal,abnormal)
- Pus Cell (nominal) pc - (normal,abnormal)
- Pus Cell clumps(nominal) pcc - (present,notpresent)
- Bacteria(nominal) ba - (present,notpresent)
- Blood Glucose Random(numerical) bgr in mgs/dl
- Blood Urea(numerical) bu in mgs/dl
- Serum Creatinine(numerical) sc in mgs/dl
- Sodium(numerical) sod in mEq/L
- Potassium(numerical) pot in mEq/L
- Hemoglobin(numerical) hemo in gms
- Packed Cell Volume(numerical) 17 .White Blood Cell Count(numerical) wc in cells/cumm
- Red Blood Cell Count(numerical) rc in millions/cmm
- Hypertension(nominal) htn - (yes,no)
- Diabetes Mellitus(nominal) dm - (yes,no)
- Coronary Artery Disease(nominal) cad - (yes,no)
- Appetite(nominal) appet - (good,poor)
- Pedal Edema(nominal) pe - (yes,no)
- Anemia(nominal) ane - (yes,no)
- Class (nominal) class - (ckd,notckd)
We make a bit of preprocessing before we train the model with the dataframe. We filled the missing values with the mean of each column and scaled down the features using the StandardScaler of sklearn.
You need python 3.9.2 or later You also need to pip install: pandas, numpy, matplotlib and sklearn.
- Clone the repository
- Run the file "main.py"
- Wait for the model to finish
- Review the prediction
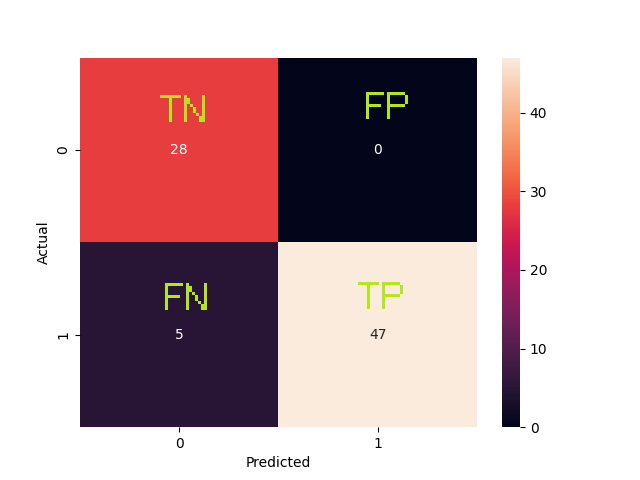
| Metric | Description | Value |
|---|---|---|
| Accuracy | Overall, how often is the classifier correct? | 0.9375 |
| True Positive Rate | When it is actually yes, how often does it predict yes? | 0.9038 |
| Precision | When it predicts yes, how often is it correct? | 1.0 |
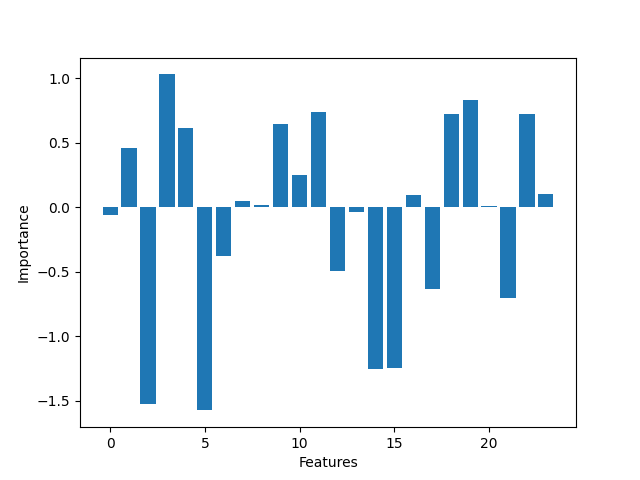
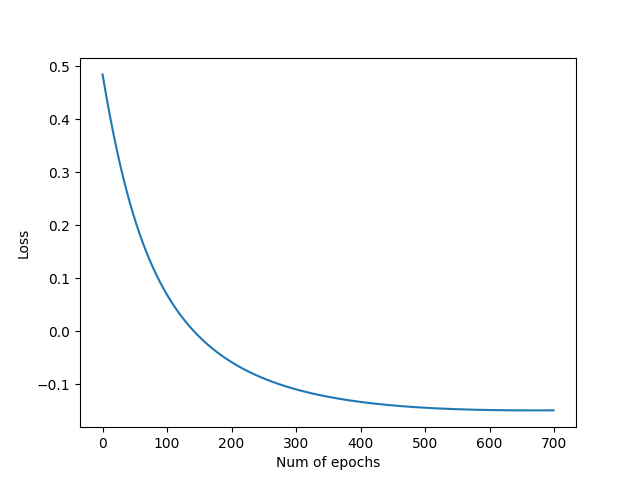
As we can see the most significant features are the ones the ones who have more influence over the binary classification. Logistic regression is fine for this kind of problems but maybe not enough for more complex data. It was a wiser decission to fill the missing values rather than drop them, because the more data we feed into the model the better. The difference between the by hand and framework implementation isn't that high. We found that changing the learning rate and the number epochs can improve the accuracy of the model. The sweet spot for a learning rate of 0.005 is ~700 epochs, more epochs can degrade the score.
Because we only analyze data from one source, it may be too soon to make generalized conclusions. Also this serves only as an aproximation, by no means you should take this seriously, you should seeks advice with a medical professionals.
[1]"UCI Machine Learning Repository: Chronic_Kidney_Disease Data Set", Archive.ics.uci.edu, 2022. [Online]. Available: https://archive.ics.uci.edu/ml/datasets/Chronic_Kidney_Disease#. [Accessed: 04- Mar- 2022].
[2]W. Disease? and N. Health, "What Is Chronic Kidney Disease? | NIDDK", National Institute of Diabetes and Digestive and Kidney Diseases, 2022. [Online]. Available: https://www.niddk.nih.gov/health-information/kidney-disease/chronic-kidney-disease-ckd/what-is-chronic-kidney-disease. [Accessed: 05- Mar- 2022].