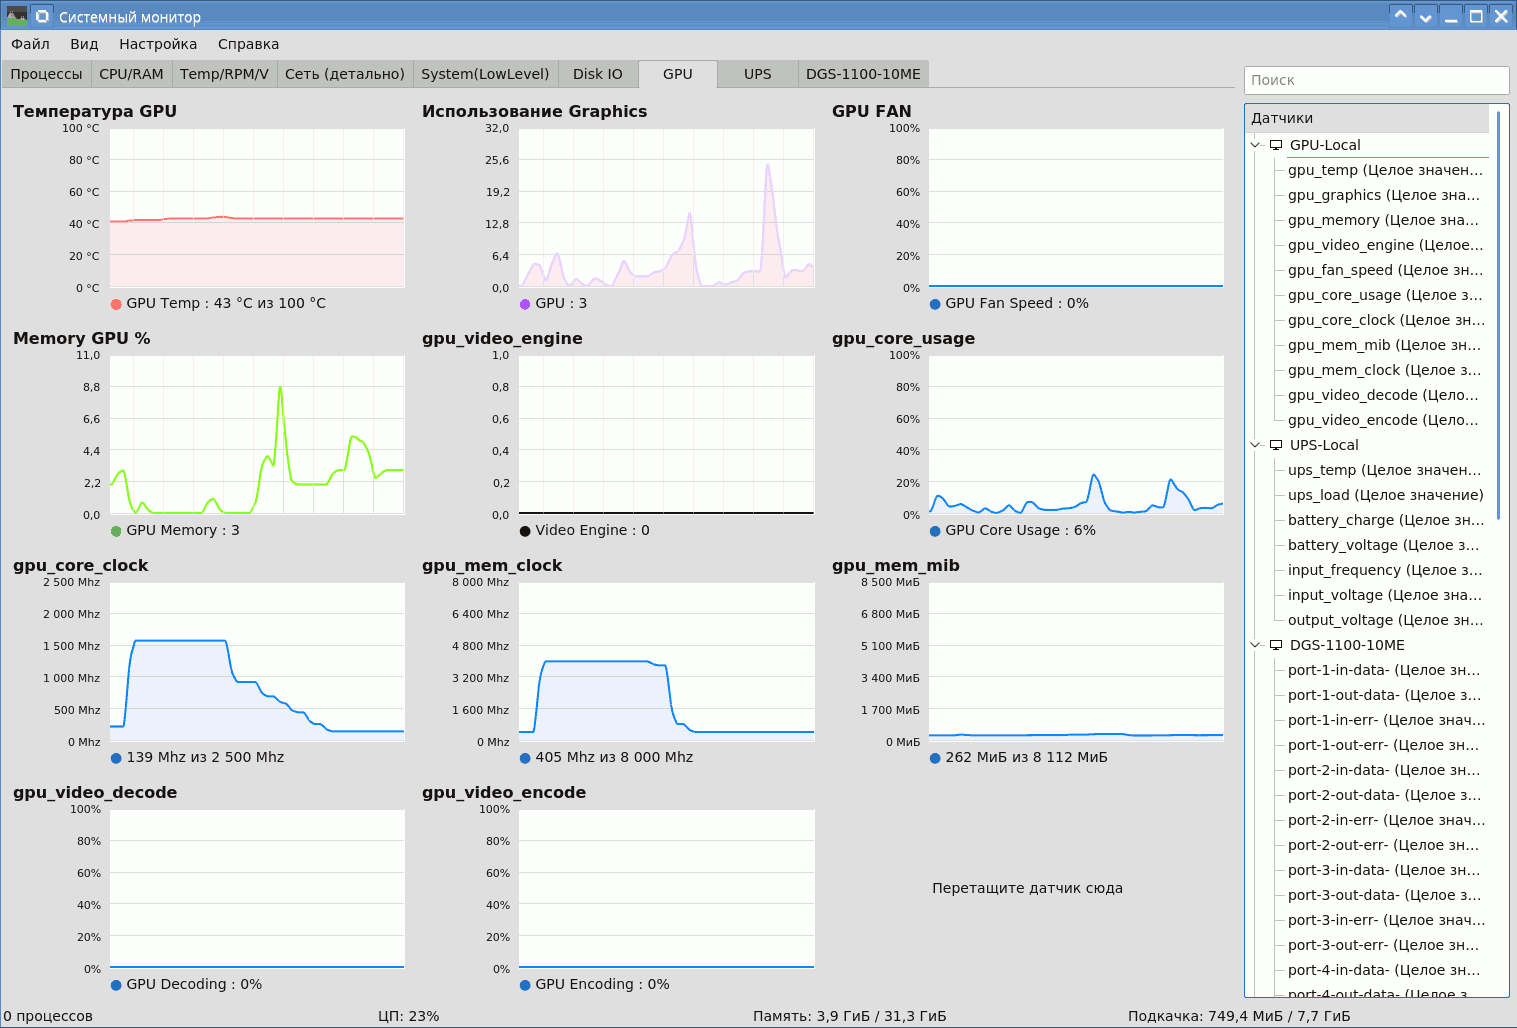
Some tweaks and scripts for KSysGuard - Local monitoring application for KDE
Some code for add monitoring UPS, GPU and SNMP-Switches in KSysGuard.
- Perl must be installed for use .pl scripts
Download required opt-scripts to some path, ex. in /opt
- Run ksysguard, create new tab, swith to this and call menu File - Monitoring remote host
- Type as computer name any string, ex. "My UPS", use connection type = "another command"
- In command field type
perl /opt/$script_name.pl - !! Add at least one data sensor from added script to new tab. In other case ksysguard remove unused sources from right sensors panel !!
- Some scripts (ex dgs1100-mon.pl) need edit - change IP / SNMP community and ports count.
- Use sgrd-template for create graph tab or create this manually. If template has another hosts / interfaces names - your can easy change it, sgrd-files is trivial XML.
Your system need tools nvidia-smi and nvidia-settings - this included in proprietary nvidia driver package.
Script monitoring only one (first) GPU (i suggest home / ofiice usage) - for mining farm use server-based systems, ex. zabbix.
Make steps from # Installation, use /opt/nvmon.pl
Add tab from SGRD/GPU.sgrd template or create customized panels
At first your must install and configure nut (Network UPS Tools). For monitoring need only working upsc tool.
Use upsc -l for show UPS name ( ex. ippon3000) and upsc ippon3000 for check UPD data.
Use nut manuals for configure.
Make steps from # Installation, use /opt/upsmon.pl
By default script monitoring only one, first UPS. In need another - modify script , see $upc variable.
Add tab from SGRD/UPS.sgrd template or create customized panels
SNMP is too big and have lots of sensors and data. But your can watch some values in local desktop system. Also this example can be useful for monitoring of some home/SMB/IoT devices like NetPing, switches, routers etc.
At first your must install snmp-tools, script rely to snmpwalk utility.
Make steps from # Installation, use /opt/dgs1100-mon.pl for example.
Configure SNMP on device - setting up community and permissions.
!!! Never use default values !!! SNMP must use non-trivial names, IP-restrictions and only required read-permissions.
Use readonly-communities from switch. Edit /opt/dgs1100-mon.pl - change IP, community and number of ports.
Your can use SGRD/DGS-1100-10ME.sgrd as example board.
This script collect only Input/Output Octets and Errors counters from selected switch. For other values refer to SNMP-OID databases. Some SNMP-OIDs can be vendors-specific - see vendor's websites.
-
Why not use zabbix / nagios / grafana / other big monitoring system ?
- KSysGuard can't replace big monitoring systems, this for simple and user-friendly localhost monitoring. For episodical watching of small numbers of sensors, like GPU Temp/memory load, UPS battery and router summary traffic make zabbix server too overkill, even on oneboard-comp like raspberry. If your dont't need long-term history and simple view current state - use ksysguard locally.
-
What about AMD GPU ?
- I don't have AMD GPU and don't know how monitor this. You can make pull requests with script.
-
What about another SGRD-files ?
- It's templates for comfortable monitoring of some aspects - HDD, Network, System and Hardware-sensors. I use this on my linux desktops. Before import your can edit sgrd-file for change disks / interfaces names by find-and-replace function in text-editor / sed / awk / other.
More info: https://aminux.wordpress.com/2020/02/10/ksysguard-add-gpu-ups-switch-snmp/
