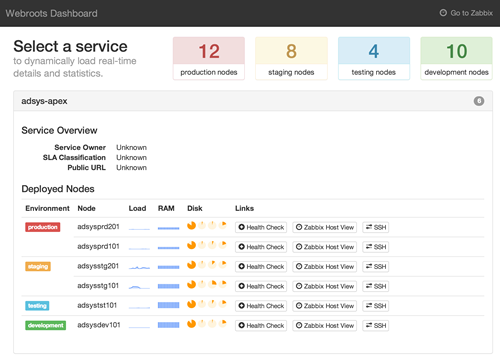
This single-page dashboard gives developers, DevOps engineers, and managers insight into the state of the Harvard University Information Technology "Webroots" application environment. Data is pulled from Zabbix monitoring using the PHPZabbixApi library, processed inline, and outputted with Bootstrap and jQuery. Live monitoring data for each service is loaded dynamically when the service is expanded.
Data is collected by querying Zabbix for items in a specific "application" across all hosts, finding hosts on which the application is running, and then querying for live monitoring data using the Zabbix history API. Peity sparklines display the data in a pretty way.
- Clone this repository into a web-accessible location using a webserver that supports PHP
- Create an account on your Zabbix server with API access enabled and read privileges to the hosts you want in the dashboard.
- Copy
lib/php/config.php.exampletolib/php/config.phpand customize it with your Zabbix connection details - Install dependencies using PHP Composer
cd zabbix-webroots-dashboard
curl -s http://getcomposer.org/installer | php
php composer.phar installThis dashboard was built to serve a specific purpose. In order for it to be useful to you, you will probably need to customize it to meet your requirements. For example, in its standard form labels and colors are set based on environments that are inferred from the server names themselves (i.e. "webprd101 => production") which is unlikely to be the same as your enviornment. The data-service.php and data-node.php are the first places to start with customizing the dashbaord to fit your needs.
