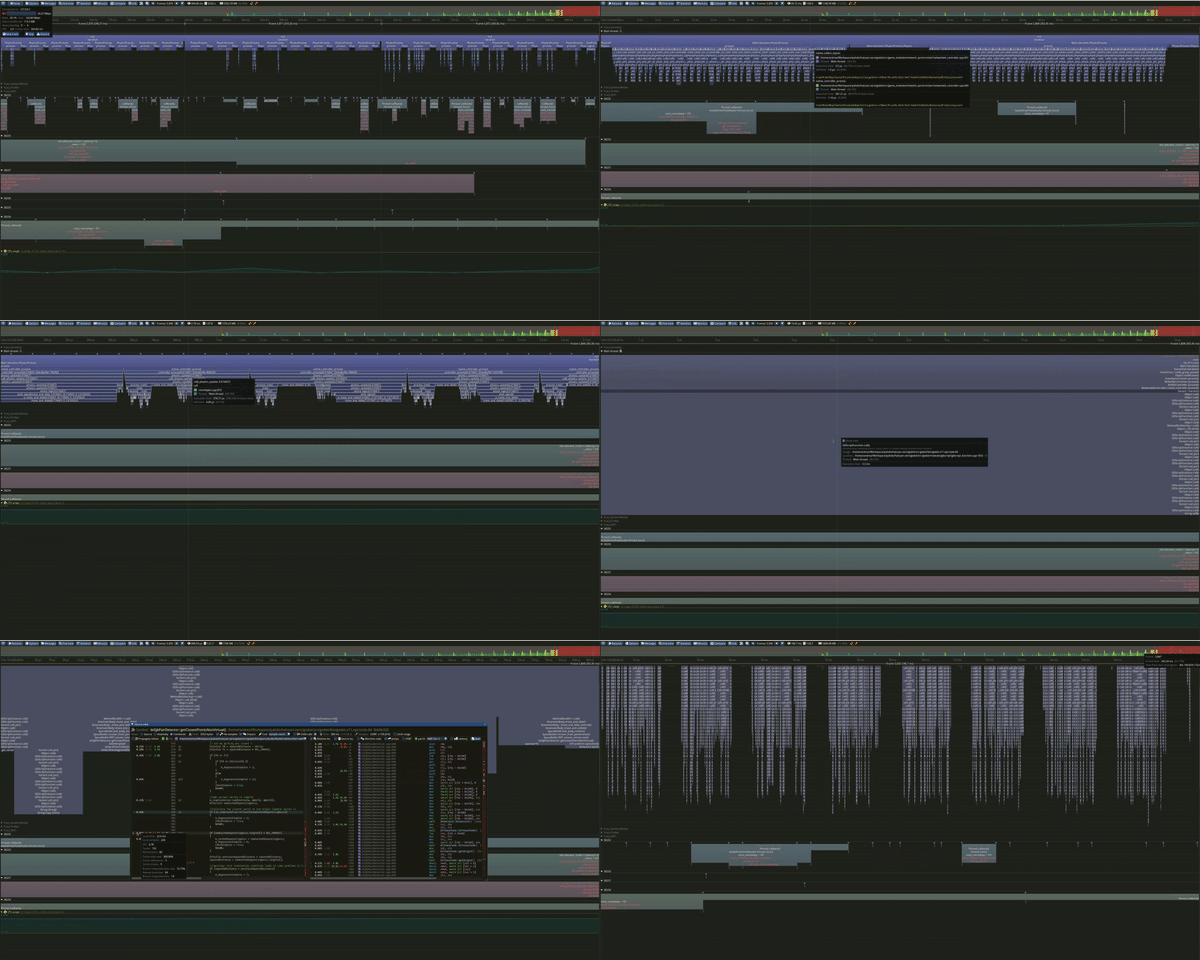
Tracy Profiler is a Godot Engine module that can be used to profile C++ and scripting at the same time, so to have good insight about what your game is really doing to take the correct actions to heal your game performance.
This module is a more feature reach and uptodated spin-off of this one module.
Tracy is composed by two parts:
- The profiler GUI (The one you see above).
- The tracy instrumentation to fetch your game information.
Get Tracy documentation and Windows profiler GUI binary can be download from releases page.
The first step is to include this module into your godot application module directory, or using the custom modules.
You can use the following command:
git clone --recurse-submodules https://github.com/AndreaCatania/godot_tracy.git
Note: If you don't use the above command make sure to execute the following one, so to fetch the
Tracyrepository.git submodule update --init --recursive
The profiler GUI allows to consult all the data gathered by tracy. If you are on windows you can just downloaded the GUI from the Tracy GitHub repository, otherwise you have to compile it yourself; do not despair it's easy!
To compile the tracy profiler GUI all you need to do is to:
- Install all the following dependency
clang libglfw3-dev libdbus-1-dev libcapstone-dev libtbb-dev libdebuginfod-dev freetype-devel.- Fedora:
sudo dnf install glfw-devel dbus-devel capstone-devel tbb-devel freetype-devel clang
- Fedora:
- Using a terminal, go into the
godot_tracy/folder. - Compile the GUI using the following command:
CC=clang CXX=clang++ make release -C ./tracy/profiler/build/unix -j `nproc`
If the above command succeeds, the following binary is produced: Tracy-release (godot_tracy/tracy/profiler/build/unix/Tracy-release).
You have to explicitly enable it by adding tracy_enable=true to your SCons build command. This is an example:
scons p=x11 target=release_debug tracy_enable=yes CCFLAGS="-fno-omit-frame-pointer -fno-inline -ggdb3"
Note: The command
CCFLAGS="-fno-omit-frame-pointer -fno-inline -ggdb3"will compile the game with all the needed debug info needed to properly profile the game.
At this point you are free to use tracy. By default tracy shows all the CPU profiling event (similarly to perf); however, tracy gives the possibility to instrument your binary to add extra information:
FrameMark;Is used to tell tracy the beginning of the frame. Tracy will split the work per each frame so you can review any specific frame.ZoneScoped;Is used to mark a specific function.TracyMessage;Is used to log an event. This is really useful to report some useful information to know the exact application status.
Note 1: Alot more commands are available, for example you can customize the zone name, or add extra information (like the node_path, or the function arguments values, etc..). Please review the tracy documentation.
Note 2: The bare minimum is to add the
FrameMark;andZoneScoped;macros inside the platform specific::run() {function:Linux
void OS_LinuxBSD::run() {
	force_quit = false;

	if (!main_loop) {
		return;
	}

	main_loop->init();

	//uint64_t last_ticks=get_ticks_usec();

	//int frames=0;
	//uint64_t frame=0;

	while (!force_quit) {
		FrameMark;
		ZoneScoped;

		process_xevents(); // get rid of pending events
#ifdef JOYDEV_ENABLED
		joypad->process_joypads();
#endif
		if (Main::iteration()) {
			break;
		}
	};

	main_loop->finish();
}
This module provides the TracyProfiler singleton that can be used to mark specific GDScript zones, add messages, etc..
class_name Enemy

func _physics_process(delta):
	var zone = TracyProfiler.zone_begin("Enemy::_physics_process")
	TracyProfiler.zone_set_text("NodePath: " + get_path())
	TracyProfiler.zone_set_color(Color::red);

	# Here some code!

	TracyProfiler.zone_end(zone)
This is just an example, there are some other functions that is possible to use to mark a zone.
It's also possible to log the message using:
func _process(delta):
	TracyProfiler.message("Process started. The delta is: " + delta)
However, this is not the best way to profile the godot scripting, as it needs some invasive changes to your codebase. Instead, a smarter way is to add the macro ZoneScoped to specific godot areas, that are used to execute scripting functions.
Following all the areas where you have to add the code:
object.cpp
#include "godot_tracy/profiler.h"

void Object::call_multilevel(const StringName &p_method, const Variant **p_args, int p_argcount) {
	ZoneScoped;
	CharString c = Profiler::stringify_method(p_method, p_args, p_argcount);
	ZoneName(c.ptr(), c.size());

	...
}

Variant Object::call(const StringName &p_method, const Variant **p_args, int p_argcount, Variant::CallError &r_error) {
	ZoneScoped;
	CharString c = Profiler::stringify_method(p_method, p_args, p_argcount);
	ZoneName(c.ptr(), c.size());

	...
}
variant.cpp
#include "godot_tracy/profiler.h"

Variant Variant::call(const StringName &p_method, VARIANT_ARG_DECLARE) {
 ZoneScoped;
 CharString c = String(p_method).utf8();
 ZoneName(c.ptr(), c.size());

 ...
}
variant_call.cpp
@@ -1241,7 +1243,12 @@ void Variant::call_ptr(const StringName &p_method, const Variant **p_args, int p
                }
 #endif
                _VariantCall::FuncData &funcdata = E->get();
-               funcdata.call(ret, *this, p_args, p_argcount, r_error);
+               {
+                       ZoneScoped;
+                       CharString c = Profiler::stringify_method(p_method, p_args, p_argcount);
+                       ZoneName(c.ptr(), c.size());
+                       funcdata.call(ret, *this, p_args, p_argcount, r_error);
+               }
        }

        if (r_error.error == Variant::CallError::CALL_OK && r_ret) {
gdscript.cpp
#include "godot_tracy/profiler.h"

Variant GDScriptInstance::callp(const StringName &p_method, const Variant **p_args, int p_argcount, Variant::CallError &r_error) {
	ZoneScoped;
	CharString c = String(p_method).utf8();
	ZoneName(c.ptr(), c.size());

	...
}If you want to have some extra info about the time spent on the physics, idle, rendering processing, it's possible to add some more ZoneScoped; macros inside the Main::iterator function, as follows:
main.cpp
@@ -2194,6 +2196,8 @@ static uint64_t frame_delta_sync_time = 0;
 #endif

 bool Main::iteration() {
+       ZoneScoped;
+
        //for now do not error on this
        //ERR_FAIL_COND_V(iterating, false);

@@ -2251,6 +2255,8 @@ bool Main::iteration() {
        bool exit = false;

        for (int iters = 0; iters < advance.physics_steps; ++iters) {
+               ZoneScopedN("Main::iteration::PhysicsProcess");
+
                if (InputDefault::get_singleton()->is_using_input_buffering() && agile_input_event_flushing) {
                        InputDefault::get_singleton()->flush_buffered_events();
                }
@@ -2270,13 +2276,19 @@ bool Main::iteration() {
                        break;
                }

-               NavigationServer::get_singleton_mut()->process(frame_slice * time_scale);
-               message_queue->flush();
+               {
+                       ZoneScopedN("Main::iteration::PhysicsProcess::Navigation");
+                       NavigationServer::get_singleton_mut()->process(frame_slice * time_scale);
+                       message_queue->flush();
+               }

-               PhysicsServer::get_singleton()->step(frame_slice * time_scale);
+               {
+                       ZoneScopedN("Main::iteration::PhysicsProcess::Physics");
+                       PhysicsServer::get_singleton()->step(frame_slice * time_scale);

-               Physics2DServer::get_singleton()->end_sync();
-               Physics2DServer::get_singleton()->step(frame_slice * time_scale);
+                       Physics2DServer::get_singleton()->end_sync();
+                       Physics2DServer::get_singleton()->step(frame_slice * time_scale);
+               }

                message_queue->flush();

@@ -2295,11 +2307,14 @@ bool Main::iteration() {

        uint64_t idle_begin = OS::get_singleton()->get_ticks_usec();

-       if (OS::get_singleton()->get_main_loop()->idle(step * time_scale)) {
-               exit = true;
+       {
+               ZoneScopedN("Main::iteration::IdleProcess");
+               if (OS::get_singleton()->get_main_loop()->idle(step * time_scale)) {
+                       exit = true;
+               }
+               visual_server_callbacks->flush();
+               message_queue->flush();
        }
-       visual_server_callbacks->flush();
-       message_queue->flush();

VisualServer::get_singleton()->sync(); //sync if still drawing from previous frames.At this point you can start the profiling:
- Launch the game to profile (even through the editor).
- Launch the tracy profiler GUI.
- Double click on one of the game instances showed on the list (or just click to
Connectbutton).
Enjoy your profiling!
