By: Andreas Svensson
Data used: Kaggle Cardiovascular Disease
Models used: Logistic Regression, KNN, Random Forest (combined through Vote Classifier)
When selecting models to use for this project, I took into consideration which models can handle binary classification problems and also provide a probability prediction. I landed on testing Logistic Regression, KNN, and Random Forest Classifier.
The data was split into 2 datasets, and 2 different scalers were used, as such 4 models were created for each algorithm. During the validation phase of the project these models were compared with each other and the best performing one chosen to use in a voting classifier.
Since this is medical data it is important to not predict wrong in case someone actually has increased risk of cardiovascular disease. Therefore, I scored models with high recall better through creating a custom scoring function that looks at both accuracy, precision, and recall but weights recall heavier than the others.
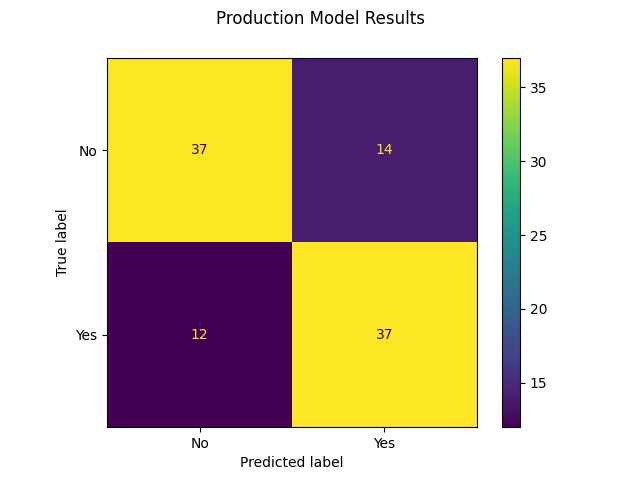
The final evaluation for selecting the model was manually looking at the plotted confusion matrix comparison. Making sure that the model predicted well overall, but weighed more towards predicting false positives than false negatives. Interestingly, the same dataset and the same scaler consistently gave better results, and as such the same dataset and scaler could be used for all 3 models going into the voting classifier.
| BMI Feature | BMI | Category |
|---|---|---|
| Moderate and Severe Thinness | less than 17 | 0 |
| Underweight | 17.0 - 18.4 | 1 |
| Normal Weight | 18.5 - 24.9 | 2 |
| Pre-obesity | 25,0 - 34.9 | 3 |
| Obesity Class I | 30.0 - 34.9 | 4 |
| Obesity Class II | 35.0 - 29.9 | 5 |
| Obesity Class III | 40 or above | 6 |
| Blood Pressure | Systolic | Diastolic | Category |
|---|---|---|---|
| Healthy | less than 120 | and less than 80 | 0 |
| Elevated | 120 - 129 | and less than 80 | 1 |
| Stage I | 130 - 139 | or 80 - 89 | 2 |
| Stage II | 140 or higher | or 90 or higher | 3 |
| Stage III | over 180 | or over 120 | 4 |
Note: stage describes stage of hypertension, where stage III is considered hypertension crisis
- File Structure
I used several notebooks to structure things more neatly, with one individual notebook for each separate model
The problem with this execution was moving variables between notebooks as they need to be saved to file in between
For the future, I would instead use python scripts for this part of the project, and only move the visuals into a notebook or even a markdown file for easy result evaluation while still keeping all variables in python files
- Gridsearch Function
I created a function for performing grid search, with the idea to be able to iterate over multiple grid searches, tuning the parameters closer to the previous best one multiple times. The idea was that this would be able to find very close to optimal hyperparameters without having to grid search over as many different parameter combinations.
In reality however, at least for this case, the performance did not change much by tuning the hyperparameters more closely. The tradeoff in computational time vs the improved score was simply not worth it.
Thus, I ended up never iterating grid searches more than once.
- Visualizing Hyperparameters
Something I didn't do in this project but in hindsight could definnitely be useful is to plot out hyperparameters. For example using an elbow plot for k in KNN could help to select a more impactful value for k with a good cost-score tradeoff.
