Have you ever wanted to graph your data professionally on a TFT LCD? But there is a problem, it is particularly difficult to create a graph because of all the calculations involved.
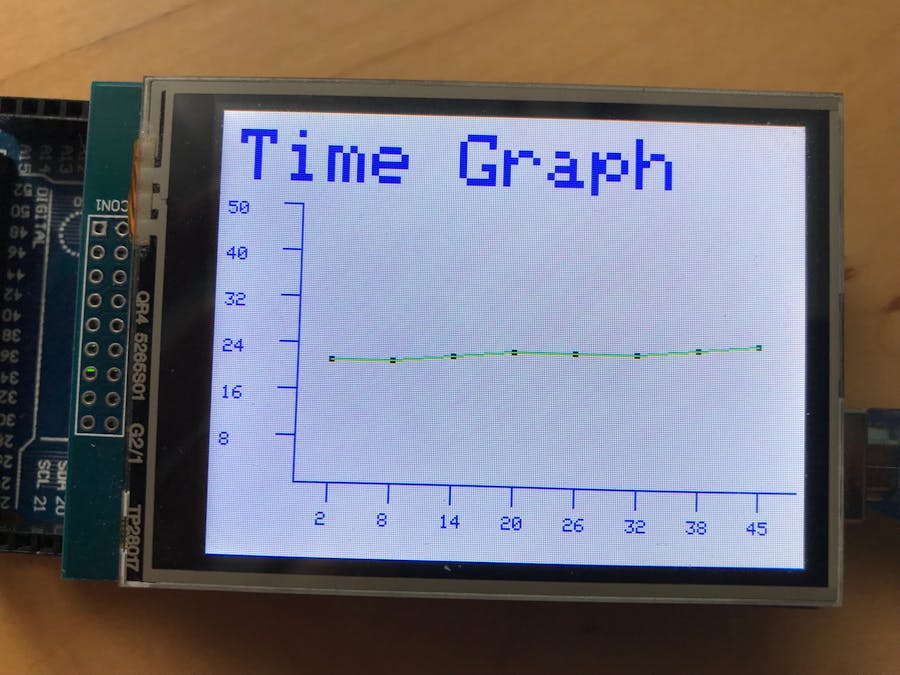
This project aims to lift all of that stress off your shoulders and allow you to create your own personalised history graph, graphing anything you want in just seconds. All you have to do is edit 5 variables.
The rest of the story together with instructions to create the project are found at this link - https://www.hackster.io/andreiflorian/tft-graphing-live-history-graphs-744f3b