Hayabusa is a Windows event log fast forensics timeline generator and threat hunting tool created by the Yamato Security group in Japan. Hayabusa means "peregrine falcon" in Japanese and was chosen as peregrine falcons are the fastest animal in the world, great at hunting and highly trainable. It is written in Rust and supports multi-threading in order to be as fast as possible. We have provided a tool to convert Sigma rules into Hayabusa rule format. The Sigma-compatible Hayabusa detection rules are written in YML in order to be as easily customizable and extensible as possible. Hayabusa can be run either on single running systems for live analysis, by gathering logs from single or multiple systems for offline analysis, or by running the Hayabusa artifact with Velociraptor for enterprise-wide threat hunting and incident response. The output will be consolidated into a single CSV timeline for easy analysis in Excel, Timeline Explorer, Elastic Stack, Timesketch, etc...
- About Hayabusa
- Screenshots
- Analyzing Sample Timeline Results
- Features
- Downloads
- Git cloning
- Advanced: Compiling From Source (Optional)
- Running Hayabusa
- Usage
- Testing Hayabusa on Sample Evtx Files
- Hayabusa Output
- Other Abbreviations
- Hayabusa Rules
- Other Windows Event Log Analyzers and Related Resources
- Windows Logging Recommendations
- Sysmon Related Projects
- Community Documentation
- Contribution
- Bug Submission
- License
Hayabusa currently has over 2600 Sigma rules and over 130 Hayabusa built-in detection rules with more rules being added regularly. It can be used for enterprise-wide proactive threat hunting as well as DFIR (Digital Forensics and Incident Response) for free with Velociraptor's Hayabusa artifact. By combining these two open-source tools, you can essentially retroactively reproduce a SIEM when there is no SIEM setup in the environment. You can learn about how to do this by watching Eric Capuano's Velociraptor walkthrough here.
Windows event log analysis has traditionally been a very long and tedious process because Windows event logs are 1) in a data format that is hard to analyze and 2) the majority of data is noise and not useful for investigations. Hayabusa's goal is to extract out only useful data and present it in a concise as possible easy-to-read format that is usable not only by professionally trained analysts but any Windows system administrator. Hayabusa hopes to let analysts get 80% of their work done in 20% of the time when compared to traditional Windows event log analysis.
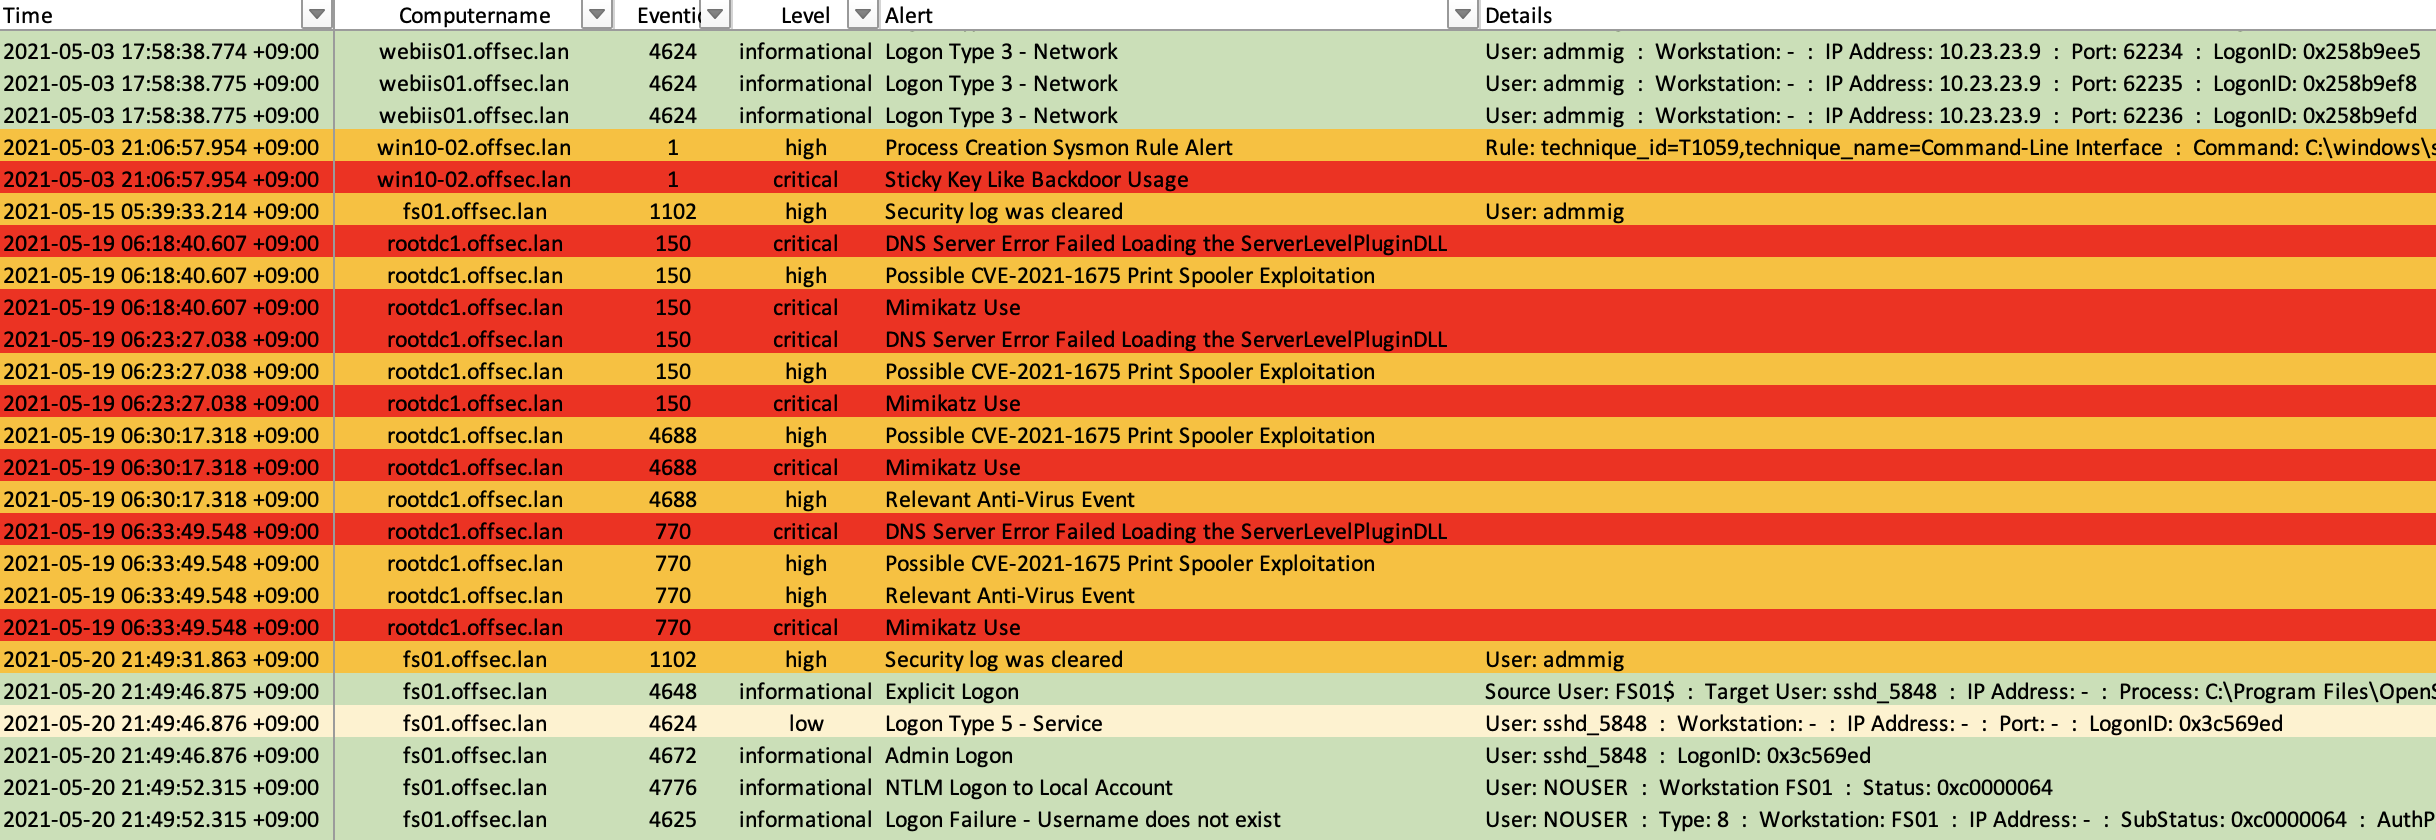
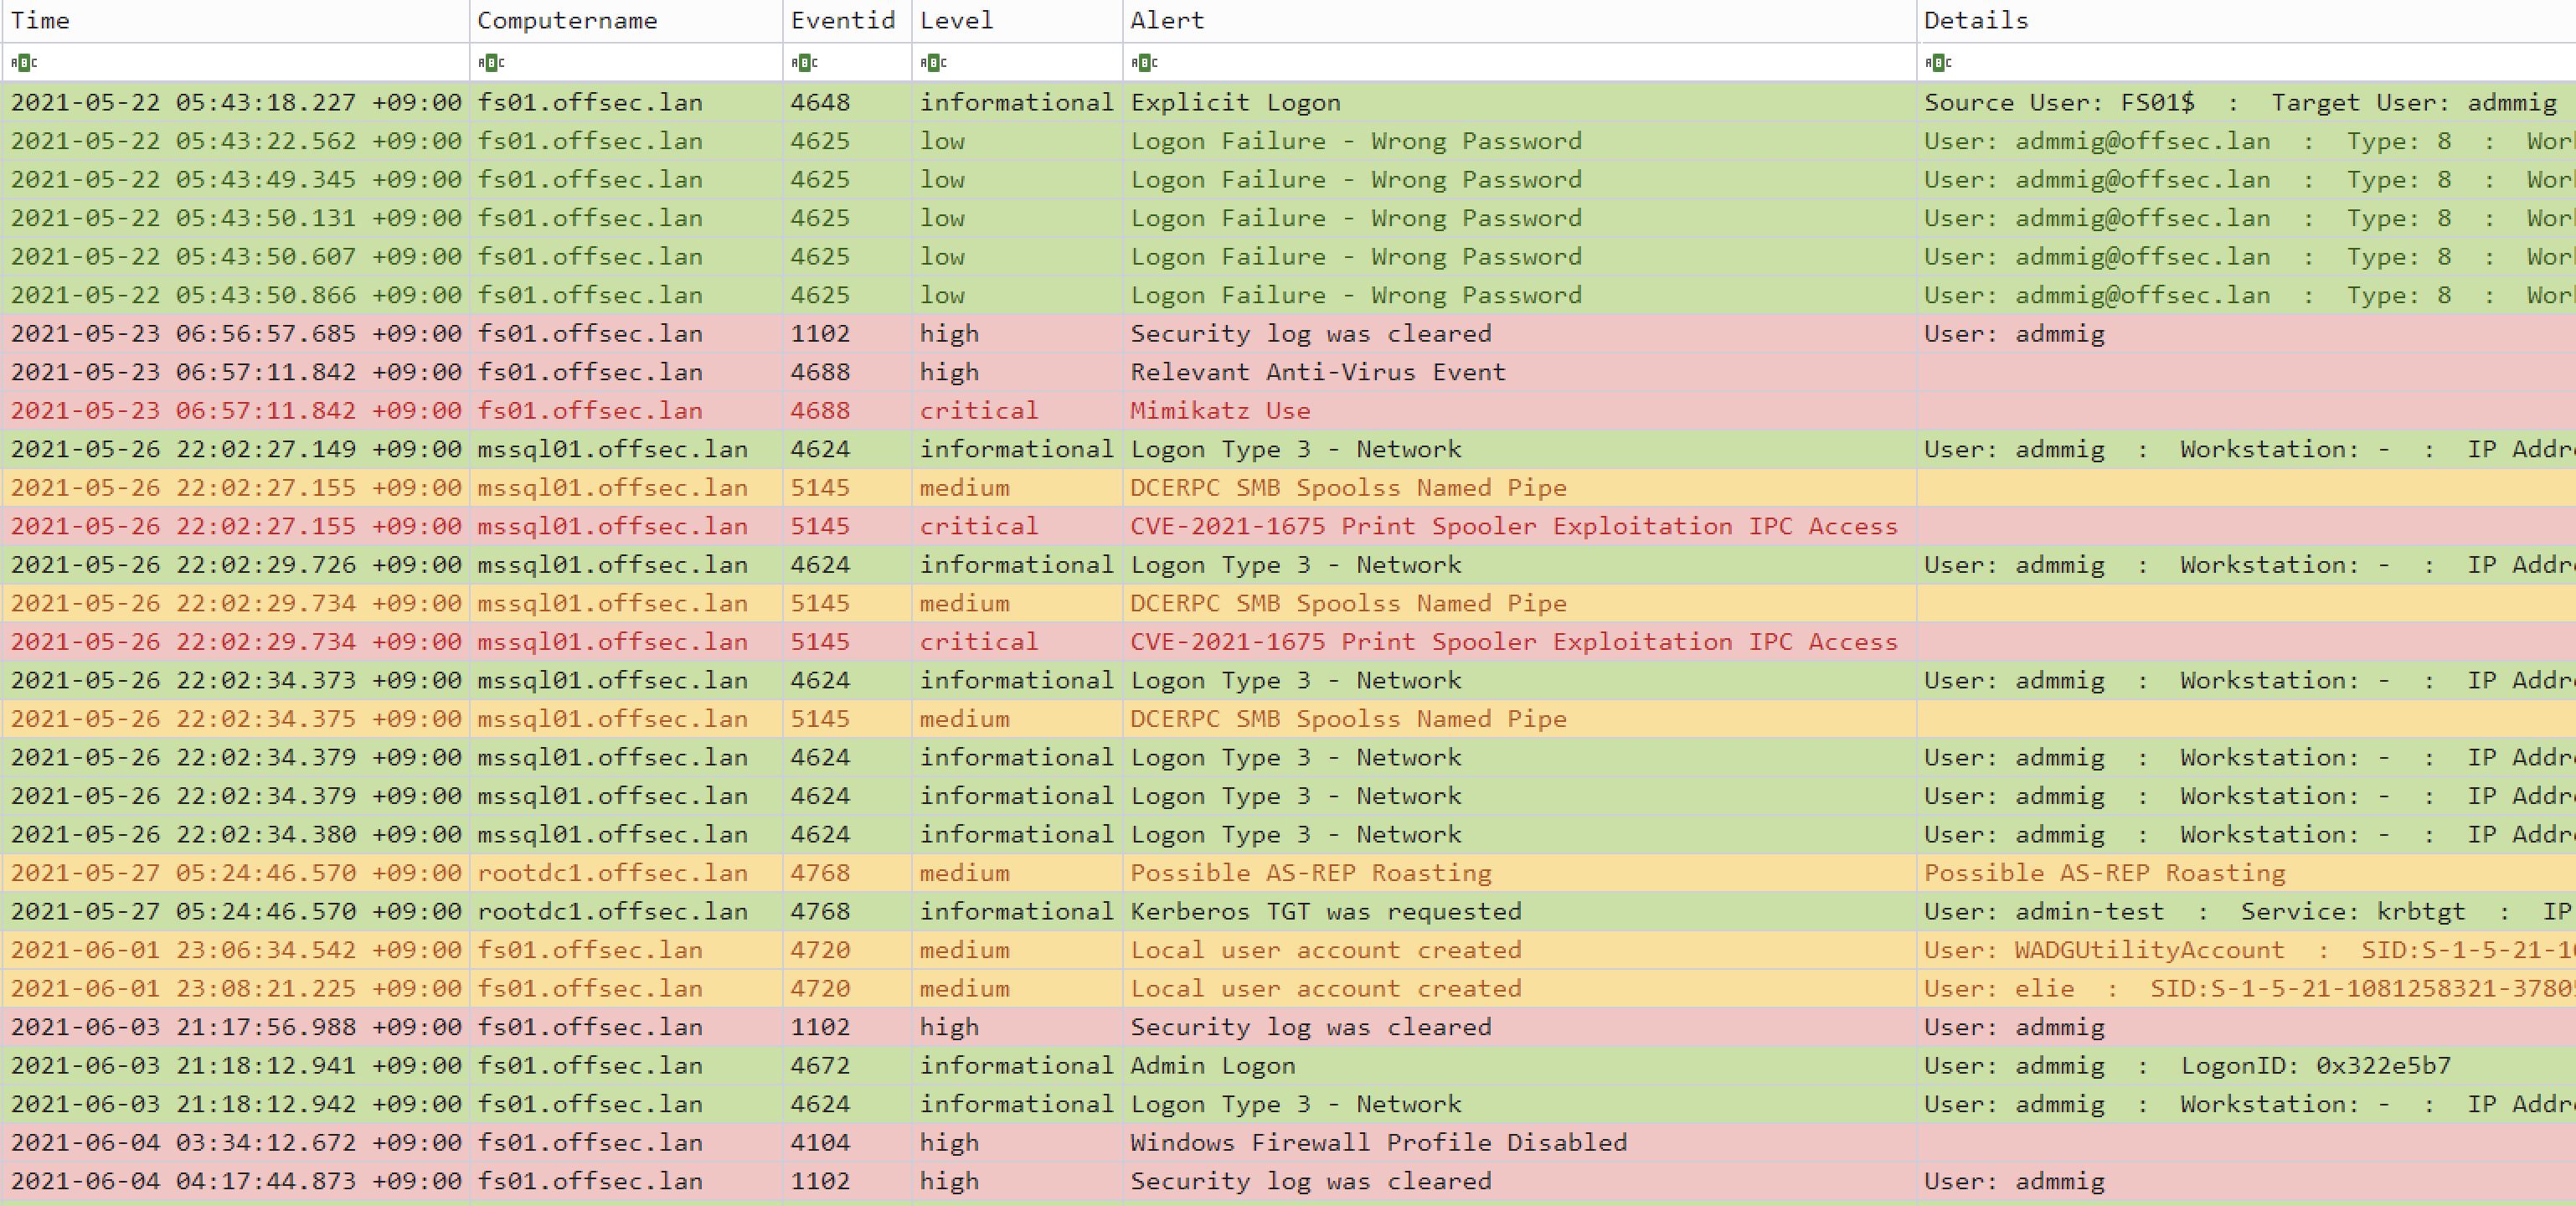
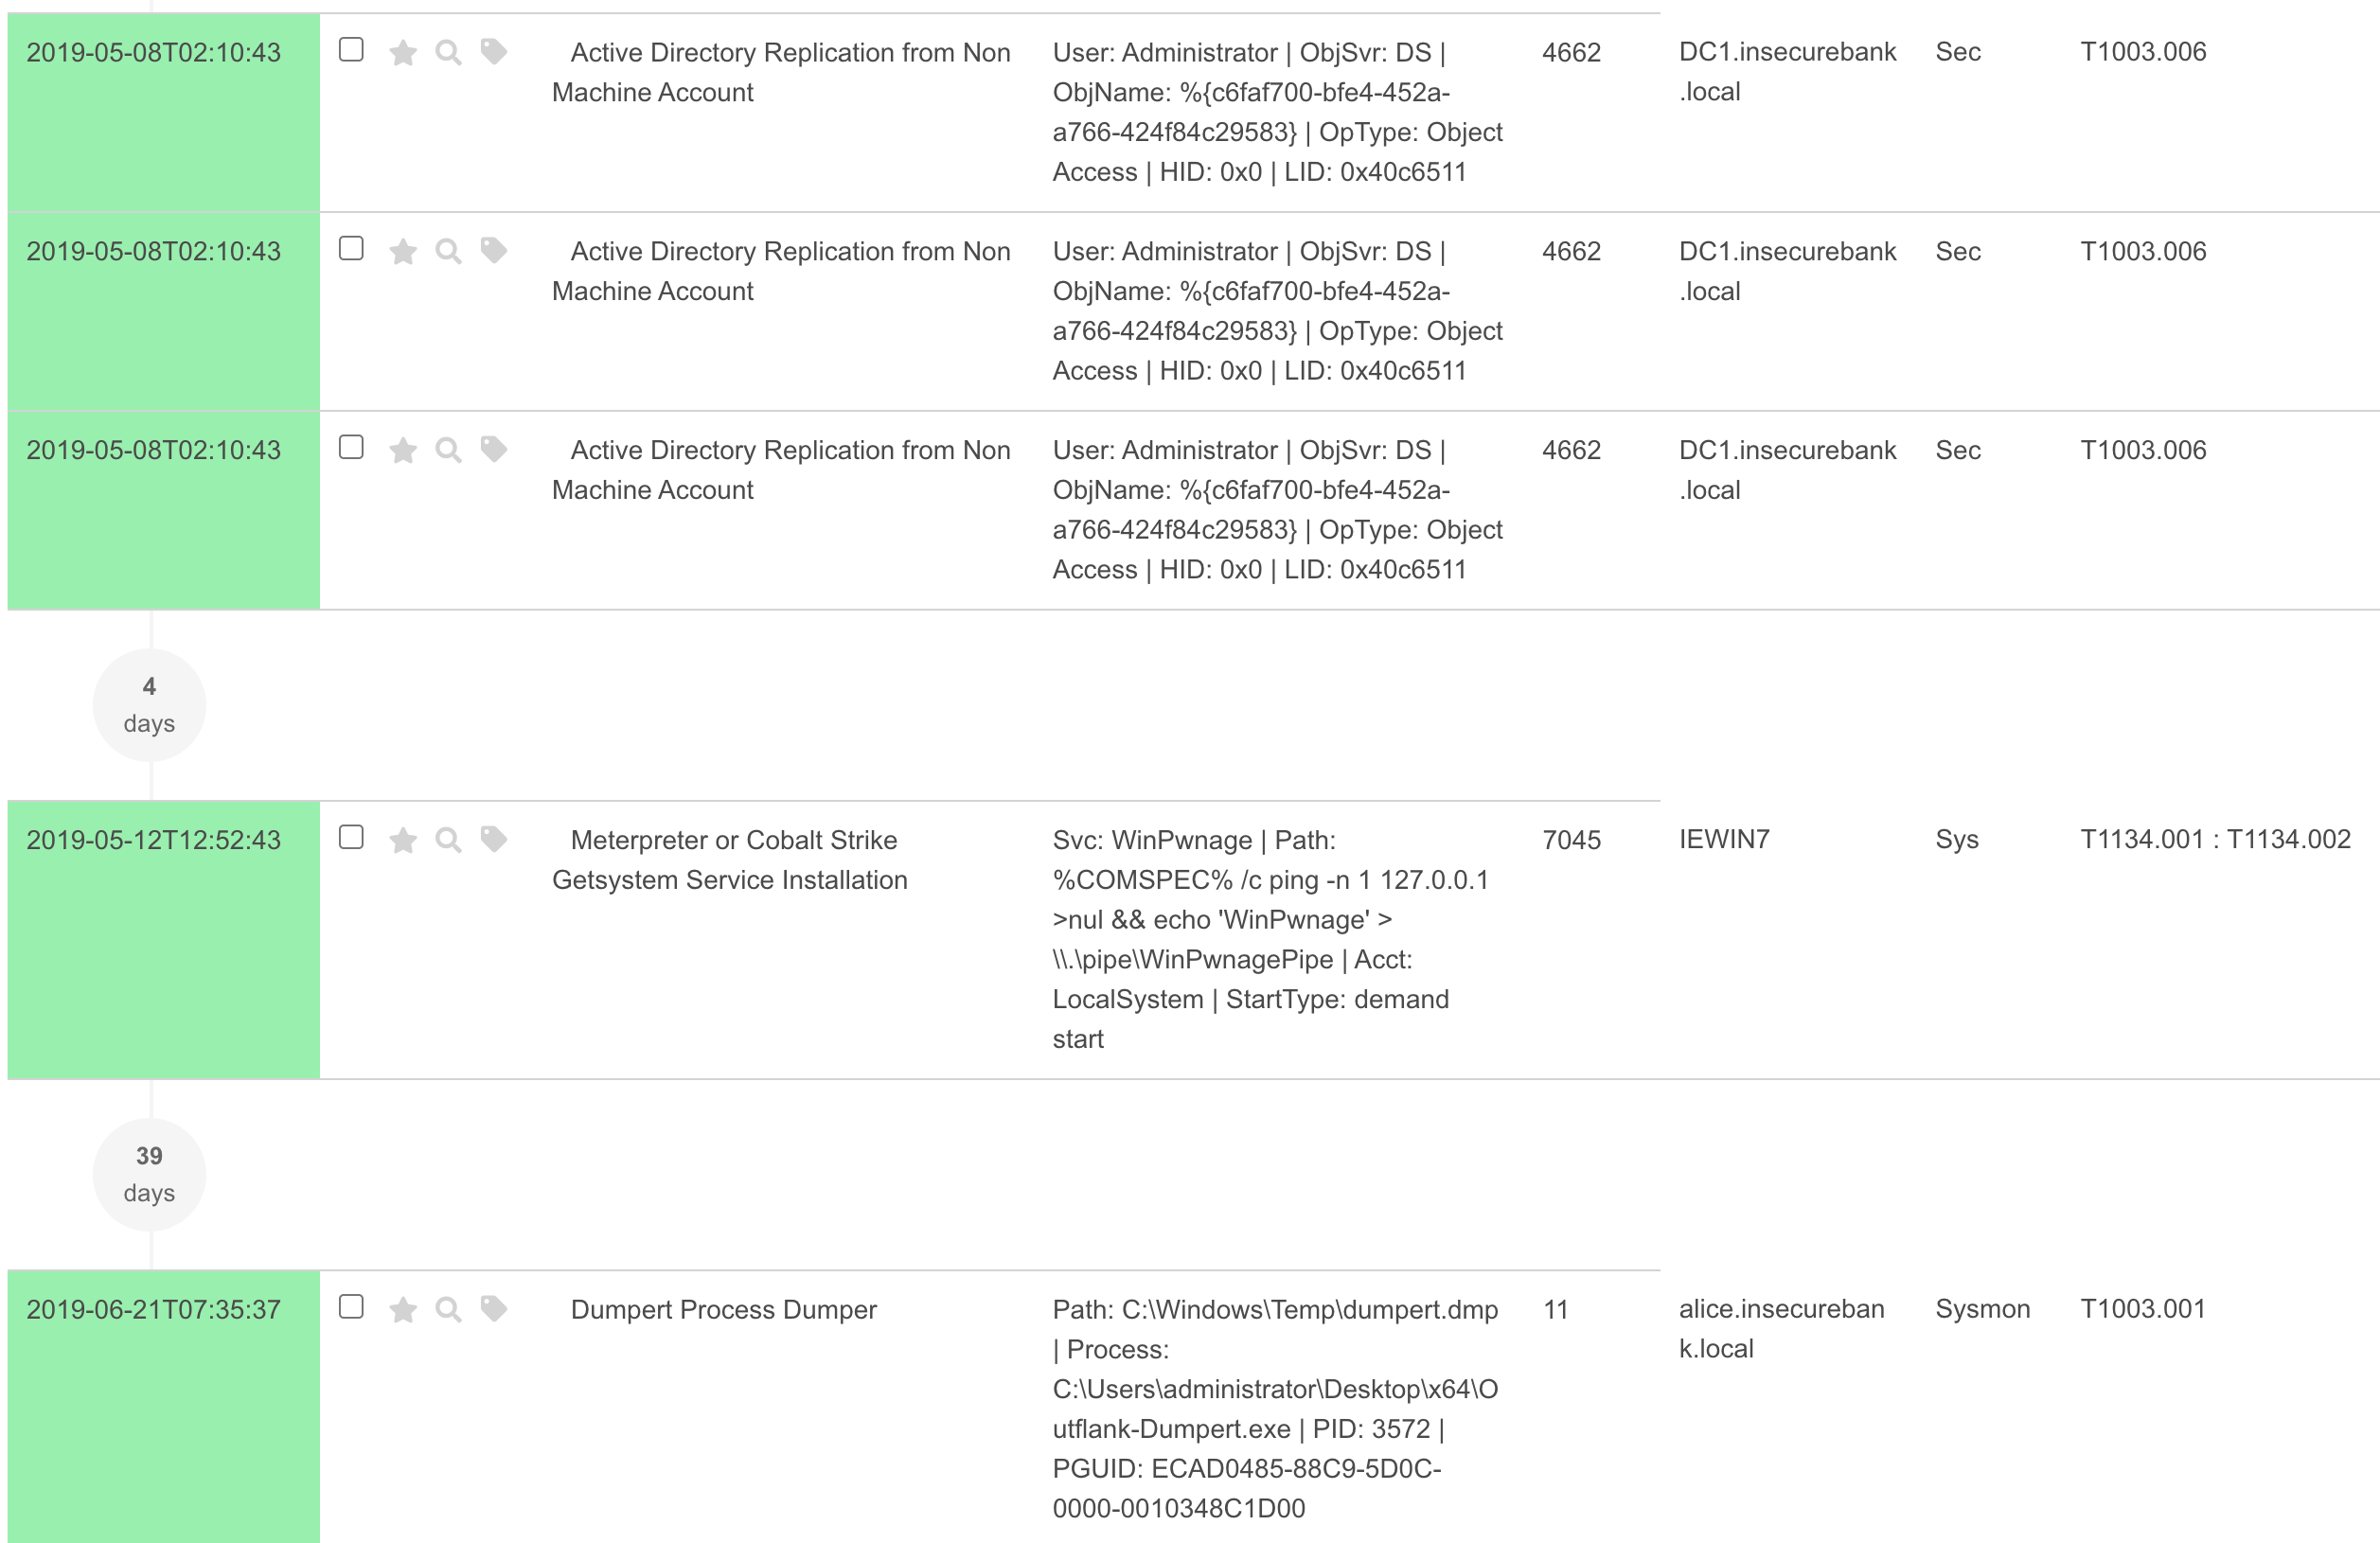
You can check out a sample CSV timeline here.
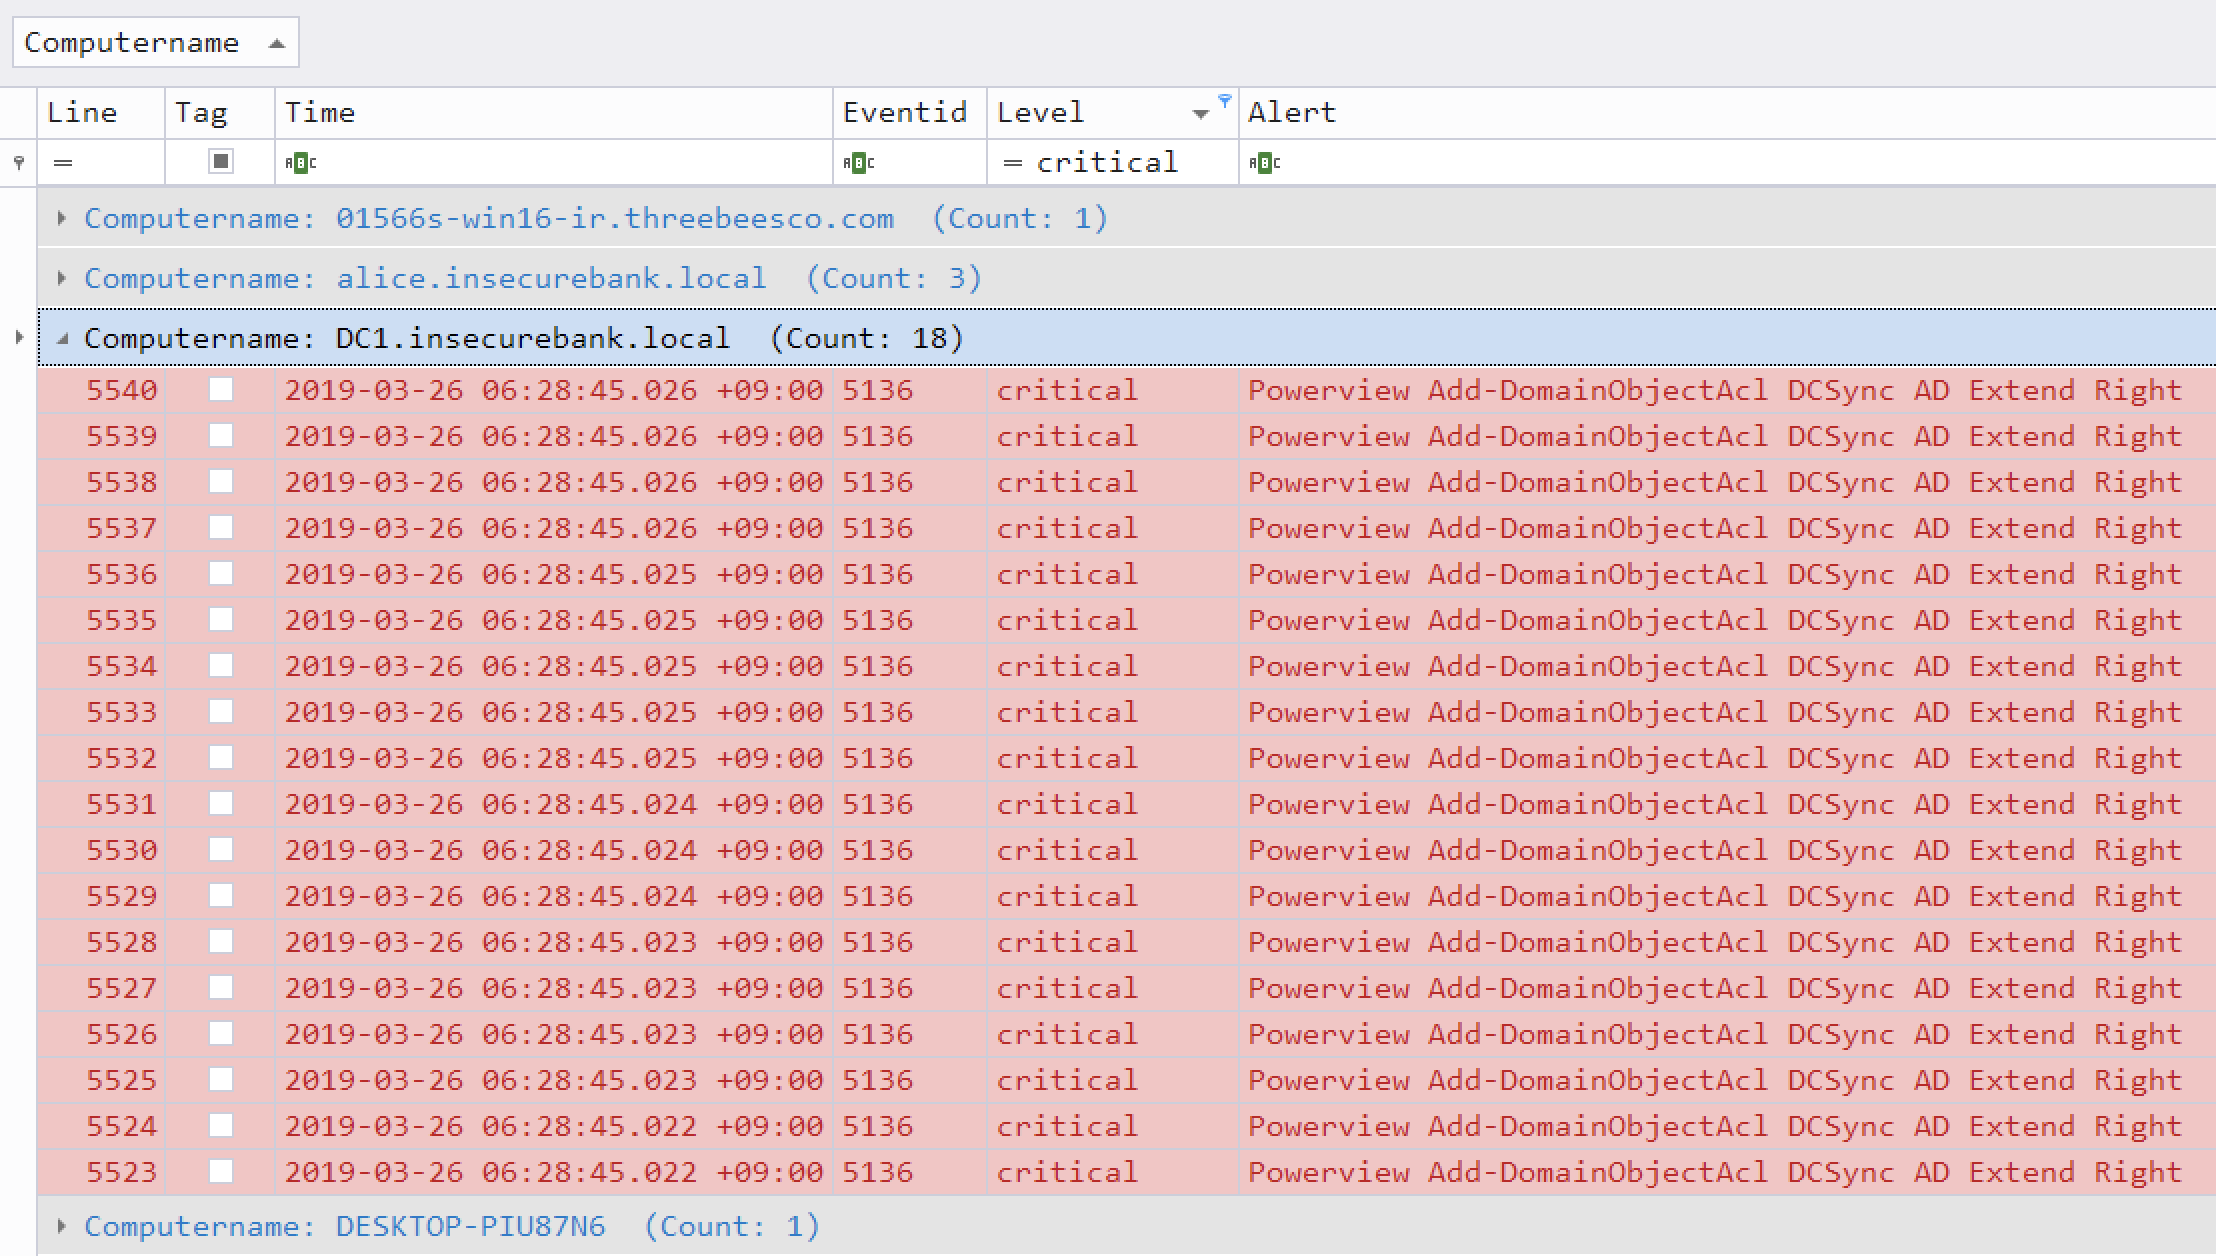
You can learn how to analyze CSV timelines in Excel and Timeline Explorer here.
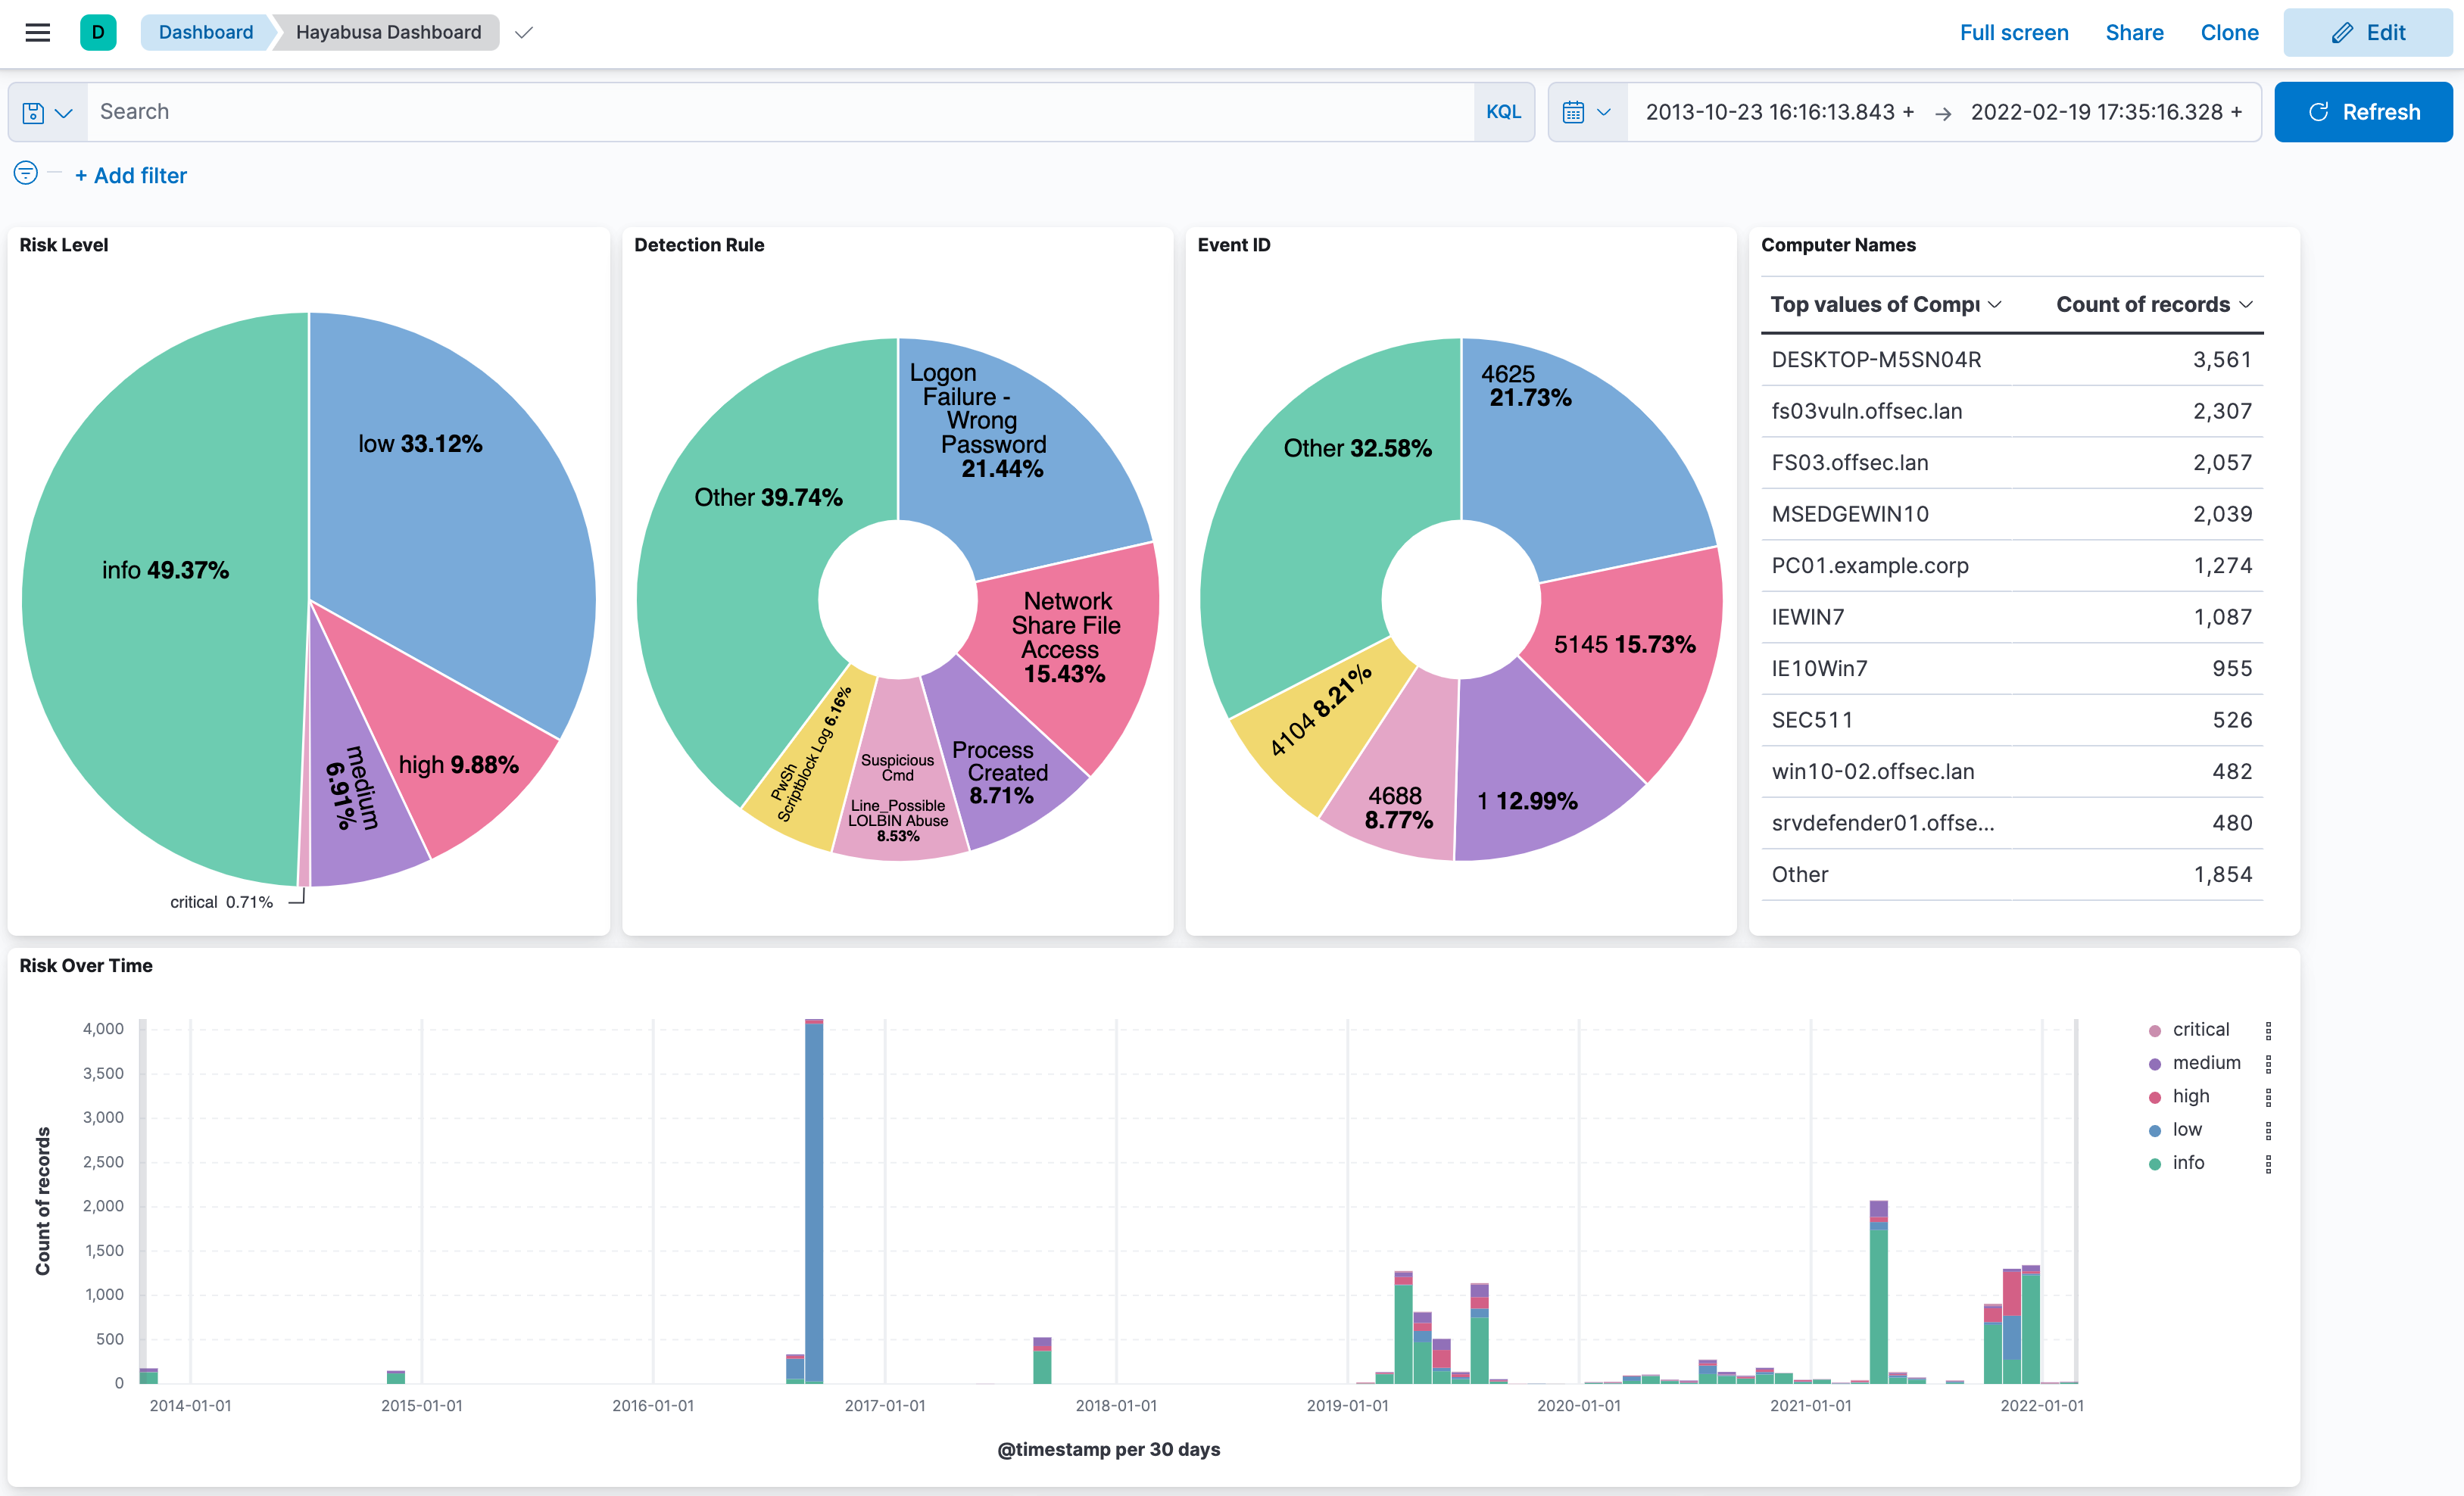
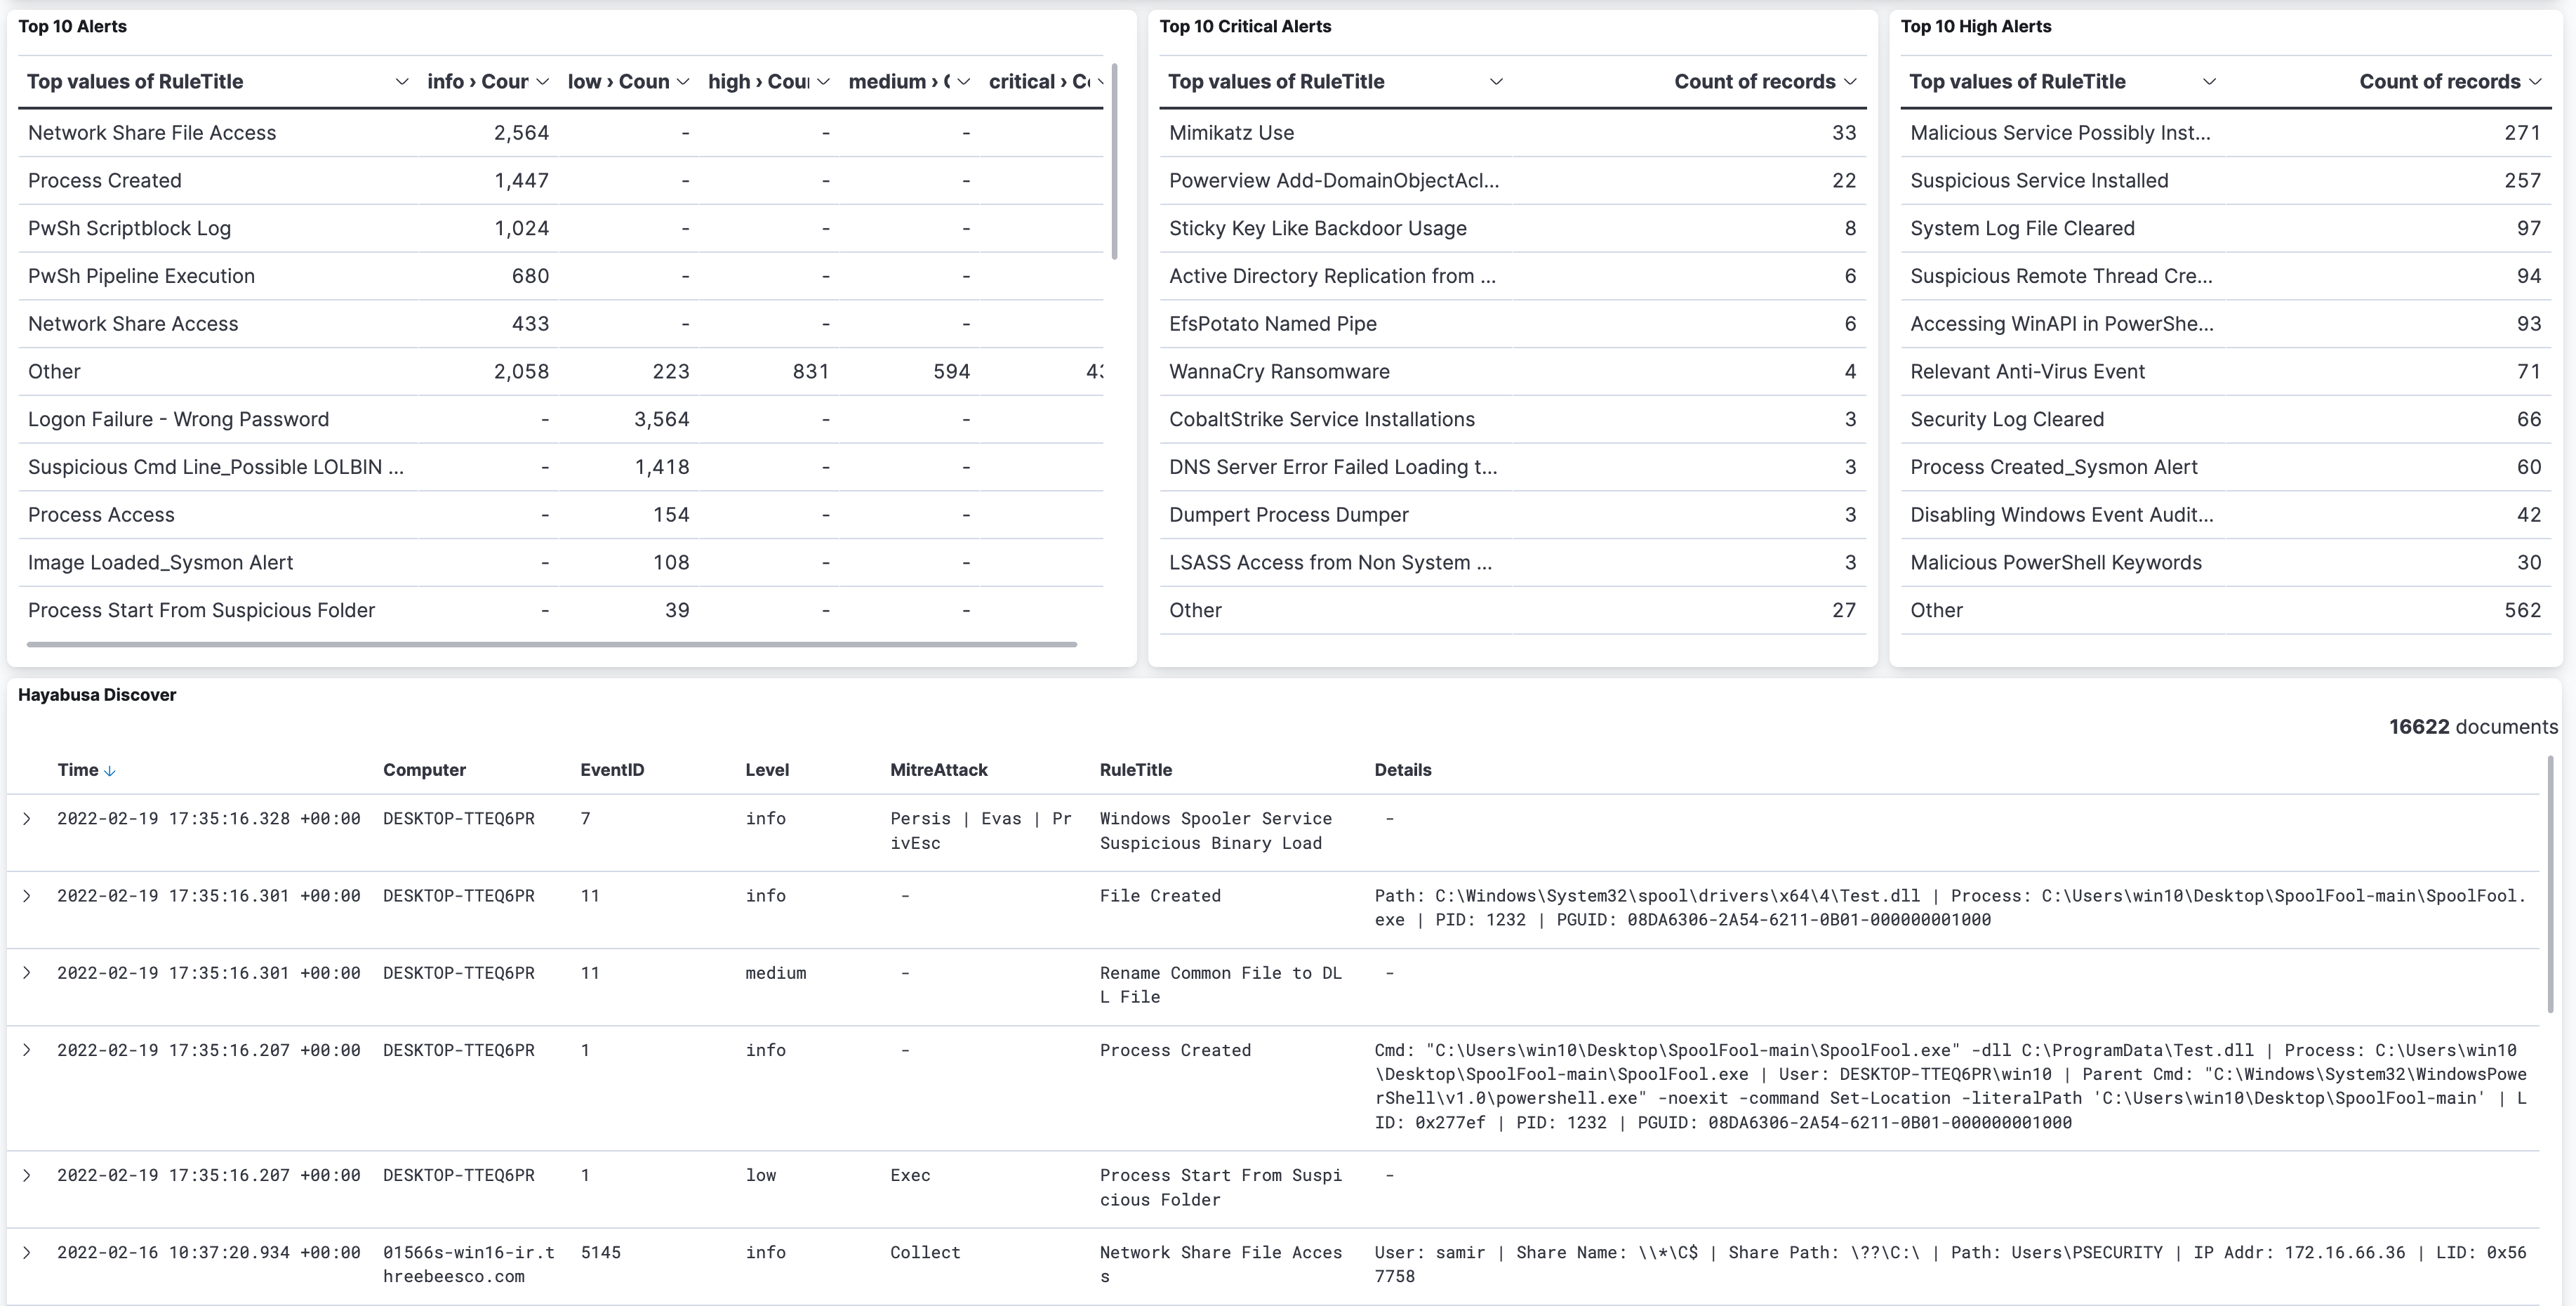
You can learn how to import CSV files into Elastic Stack here.
You can learn how to import CSV files into Timesketch here.
- Cross-platform support: Windows, Linux, macOS.
- Developed in Rust to be memory safe and faster than a hayabusa falcon!
- Multi-thread support delivering up to a 5x speed improvement.
- Creates a single easy-to-analyze CSV timeline for forensic investigations and incident response.
- Threat hunting based on IoC signatures written in easy to read/create/edit YML based hayabusa rules.
- Sigma rule support to convert sigma rules to hayabusa rules.
- Currently it supports the most sigma rules compared to other similar tools and even supports count rules and new aggregators such as
|equalsfield. - Event log statistics. (Useful for getting a picture of what types of events there are and for tuning your log settings.)
- Rule tuning configuration by excluding unneeded or noisy rules.
- MITRE ATT&CK mapping of tactics.
- Rule level tuning.
- Create a list of unique pivot keywords to quickly identify abnormal users, hostnames, processes, etc... as well as correlate events.
- Output all fields for more thorough investigations.
- Successful and failed logon summary.
- Enterprise-wide threat hunting and DFIR on all endpoints with Velociraptor.
- Output to CSV, JSON or JSONL.
Please download the latest stable version of Hayabusa with compiled binaries or compile the source code from the Releases page.
You can git clone the repository with the following command and compile binary from source code:
Warning: The main branch of the repository is for development purposes so you may be able to access new features not yet officially released, however, there may be bugs so consider it unstable.
git clone https://github.com/Yamato-Security/hayabusa.git --recursiveNote: If you forget to use --recursive option, the rules folder, which is managed as a git submodule, will not be cloned.
You can sync the rules folder and get latest Hayabusa rules with git pull --recurse-submodules or use the following command:
hayabusa-1.6.0-win-x64.exe -uIf the update fails, you may need to rename the rules folder and try again.
Caution: When updating, rules and config files in the
rulesfolder are replaced with the latest rules and config files in the hayabusa-rules repository. Any changes you make to existing files will be overwritten, so we recommend that you make backups of any files that you edit before updating. If you are performing level tuning with--level-tuning, please re-tune your rule files after each update. If you add new rules inside of therulesfolder, they will not be overwritten or deleted when updating.
If you have Rust installed, you can compile from source with the following command:
cargo build --releaseYou can download the latest unstable version from the main branch or the latest stable version from the Releases page.
Be sure to periodically update Rust with:
rustup update stableThe compiled binary will be outputted in the ./target/release folder.
You can update to the latest Rust crates before compiling:
cargo updatePlease let us know if anything breaks after you update.
You can create 32-bit binaries on 64-bit Windows systems with the following:
rustup install stable-i686-pc-windows-msvc
rustup target add i686-pc-windows-msvc
rustup run stable-i686-pc-windows-msvc cargo build --releaseIf you receive compile errors about openssl, you will need to install Homebrew and then install the following packages:
brew install pkg-config
brew install opensslIf you receive compile errors about openssl, you will need to install the following package.
Ubuntu-based distros:
sudo apt install libssl-devFedora-based distros:
sudo yum install openssl-develOn a Linux OS, first install the target.
rustup install stable-x86_64-unknown-linux-musl
rustup target add x86_64-unknown-linux-musl
Compile with:
cargo build --release --target=x86_64-unknown-linux-musl
The MUSL binary will be created in the ./target/x86_64-unknown-linux-musl/release/ directory.
MUSL binaries are are about 15% slower than the GNU binaries.
You may receive an alert from anti-virus or EDR products when trying to run hayabusa or even just when downloading the .yml rules as there will be keywords like mimikatz and suspicious PowerShell commands in the detection signature.
These are false positives so will need to configure exclusions in your security products to allow hayabusa to run.
If you are worried about malware or supply chain attacks, please check the hayabusa source code and compile the binaries yourself.
You may experience slow runtime especially on the first run after a reboot due to the real-time protection of Windows Defender. You can avoid this by temporarily turning real-time protection off or adding an exclusion to the hayabusa runtime directory. (Please take into consideration the security risks before doing these.)
In a Command/PowerShell Prompt or Windows Terminal, just run the appropriate 32-bit or 64-bit Windows binary.
Example: hayabusa-1.6.0-windows-x64.exe
You first need to make the binary executable.
chmod +x ./hayabusa-1.6.0-linux-x64-gnuThen run it from the Hayabusa root directory:
./hayabusa-1.6.0-linux-x64-gnuFrom Terminal or iTerm2, you first need to make the binary executable.
chmod +x ./hayabusa-1.6.0-mac-intelThen, try to run it from the Hayabusa root directory:
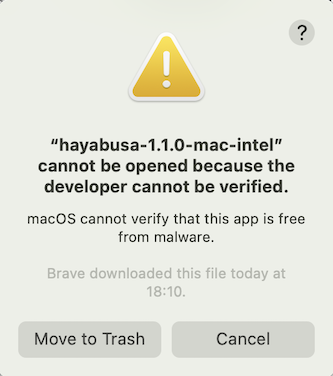
./hayabusa-1.6.0-mac-intelOn the latest version of macOS, you may receive the following security error when you try to run it:
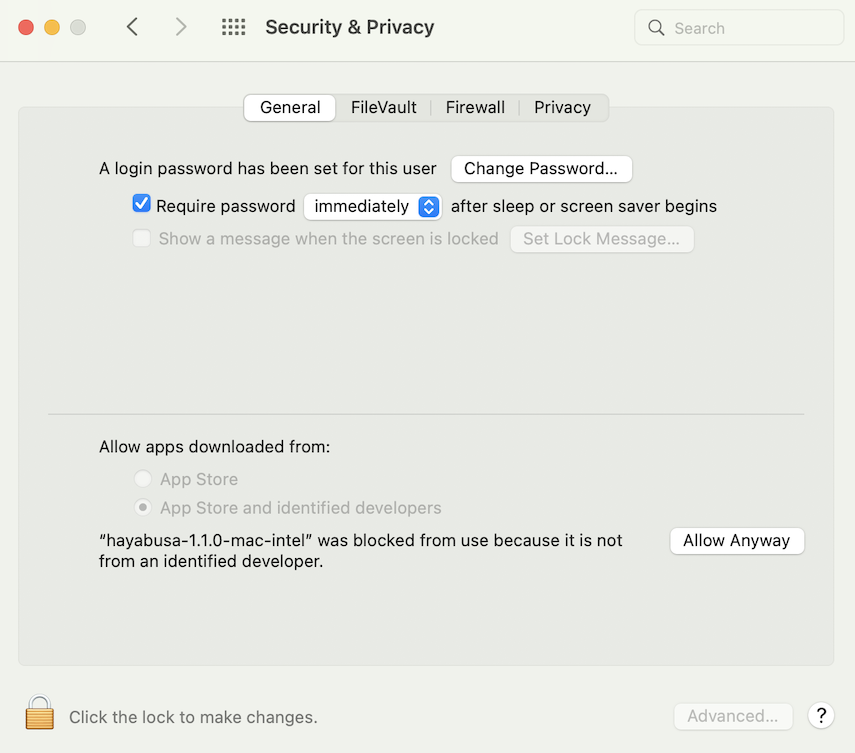
Click "Cancel" and then from System Preferences, open "Security & Privacy" and from the General tab, click "Allow Anyway".
After that, try to run it again.
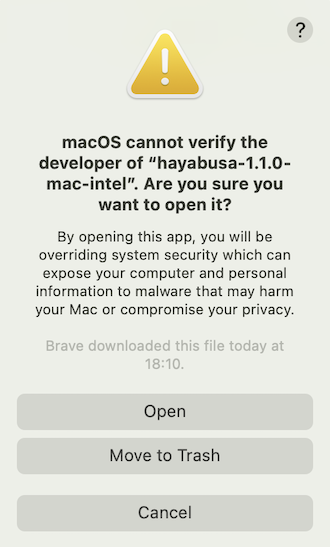
./hayabusa-1.6.0-mac-intelThe following warning will pop up, so please click "Open".
You should now be able to run hayabusa.
- default: Create a fast forensics timeline.
--level-tuning: Custom tune the alerts'level.-L, --logon-summary: Print a summary of logon events.-P, --pivot-keywords-list: Print a list of suspicious keywords to pivot on.-s, --statistics: Print metrics of the count and percentage of events based on Event ID.--set-default-profile: Change the default profile.-u, --update: Sync the rules to the latest rules in the hayabusa-rules GitHub repository.
USAGE:
    hayabusa.exe <INPUT> [OTHER-ACTIONS] [OPTIONS]

INPUT:
    -d, --directory <DIRECTORY>    Directory of multiple .evtx files
    -f, --file <FILE>              File path to one .evtx file
    -l, --live-analysis            Analyze the local C:\Windows\System32\winevt\Logs folder

ADVANCED:
    -c, --rules-config <DIRECTORY>              Specify custom rule config directory (default: ./rules/config)
    -Q, --quiet-errors                          Quiet errors mode: do not save error logs
    -r, --rules <DIRECTORY/FILE>                Specify a custom rule directory or file (default: ./rules)
    -t, --thread-number <NUMBER>                Thread number (default: optimal number for performance)
        --target-file-ext <EVTX_FILE_EXT>...    Specify additional target file extensions (ex: evtx_data) (ex: evtx1 evtx2)

OUTPUT:
    -j, --json                 Save the timeline in JSON format (ex: -j -o results.json)
    -J, --jsonl                Save the timeline in JSONL format (ex: -J -o results.jsonl)
    -o, --output <FILE>        Save the timeline in CSV format (ex: results.csv)
    -P, --profile <PROFILE>    Specify output profile (minimal, standard, verbose, verbose-all-field-info, verbose-details-and-all-field-info)

DISPLAY-SETTINGS:
        --no-color              Disable color output
        --no-summary            Do not display result summary
    -q, --quiet                 Quiet mode: do not display the launch banner
    -v, --verbose               Output verbose information
    -V, --visualize-timeline    Output event frequency timeline

FILTERING:
    -D, --deep-scan                     Disable event ID filter to scan all events (slower)
        --enable-deprecated-rules       Enable rules marked as deprecated
        --exclude-status <STATUS>...    Ignore rules according to status (ex: experimental) (ex: stable test)
    -m, --min-level <LEVEL>             Minimum level for rules (default: informational)
    -n, --enable-noisy-rules            Enable rules marked as noisy
        --timeline-end <DATE>           End time of the event logs to load (ex: "2022-02-22 23:59:59 +09:00")
        --timeline-start <DATE>         Start time of the event logs to load (ex: "2020-02-22 00:00:00 +09:00")

OTHER-ACTIONS:
        --contributors                     Print the list of contributors
    -L, --logon-summary                    Print a summary of successful and failed logons
        --level-tuning [<FILE>]            Tune alert levels (default: ./rules/config/level_tuning.txt)
    -p, --pivot-keywords-list              Create a list of pivot keywords
    -s, --statistics                       Print statistics of event IDs
        --set-default-profile <PROFILE>    Set default output profile
    -u, --update-rules                     Update to the latest rules in the hayabusa-rules github repository

TIME-FORMAT:
        --European-time       Output timestamp in European time format (ex: 22-02-2022 22:00:00.123 +02:00)
        --RFC-2822            Output timestamp in RFC 2822 format (ex: Fri, 22 Feb 2022 22:00:00 -0600)
        --RFC-3339            Output timestamp in RFC 3339 format (ex: 2022-02-22 22:00:00.123456-06:00)
        --US-military-time    Output timestamp in US military time format (ex: 02-22-2022 22:00:00.123 -06:00)
        --US-time             Output timestamp in US time format (ex: 02-22-2022 10:00:00.123 PM -06:00)
    -U, --UTC                 Output time in UTC format (default: local time)
- Run hayabusa against one Windows event log file with default standard profile:
hayabusa-1.6.0-win-x64.exe -f eventlog.evtx- Run hayabusa against the sample-evtx directory with multiple Windows event log files with the verbose profile:
hayabusa-1.6.0-win-x64.exe -d .\hayabusa-sample-evtx -P verbose- Export to a single CSV file for further analysis with excel, timeline explorer, elastic stack, etc... and include all field information (Warning: your file output size will become much larger with the
verbose-details-and-all-field-infoprofile!):
hayabusa-1.6.0-win-x64.exe -d .\hayabusa-sample-evtx -o results.csv -P verbose-details-and-all-field-info- Save the timline in JSON format:
hayabusa-1.6.0-win-x64.exe -d .\hayabusa-sample-evtx -o results.json -j- Only run hayabusa rules (the default is to run all the rules in
-r .\rules):
hayabusa-1.6.0-win-x64.exe -d .\hayabusa-sample-evtx -r .\rules\hayabusa -o results.csv- Only run hayabusa rules for logs that are enabled by default on Windows:
hayabusa-1.6.0-win-x64.exe -d .\hayabusa-sample-evtx -r .\rules\hayabusa\default -o results.csv- Only run hayabusa rules for sysmon logs:
hayabusa-1.6.0-win-x64.exe -d .\hayabusa-sample-evtx -r .\rules\hayabusa\sysmon -o results.csv- Only run sigma rules:
hayabusa-1.6.0-win-x64.exe -d .\hayabusa-sample-evtx -r .\rules\sigma -o results.csv- Enable deprecated rules (those with
statusmarked asdeprecated) and noisy rules (those whose rule ID is listed in.\rules\config\noisy_rules.txt):
hayabusa-1.6.0-win-x64.exe -d .\hayabusa-sample-evtx --enable-noisy-rules --enable-deprecated-rules -o results.csv- Only run rules to analyze logons and output in the UTC timezone:
hayabusa-1.6.0-win-x64.exe -d .\hayabusa-sample-evtx -r .\rules\hayabusa\default\events\Security\Logons -U -o results.csv- Run on a live Windows machine (requires Administrator privileges) and only detect alerts (potentially malicious behavior):
hayabusa-1.6.0-win-x64.exe -l -m low- Create a list of pivot keywords from critical alerts and save the results. (Results will be saved to
keywords-Ip Addresses.txt,keywords-Users.txt, etc...):
hayabusa-1.6.0-win-x64.exe -l -m critical -p -o keywords- Print Event ID statistics:
hayabusa-1.6.0-win-x64.exe -f Security.evtx -s- Print logon summary:
hayabusa-1.6.0-win-x64.exe -L -f Security.evtx -s- Print verbose information (useful for determining which files take long to process, parsing errors, etc...):
hayabusa-1.6.0-win-x64.exe -d .\hayabusa-sample-evtx -v- Verbose output example:
Checking target evtx FilePath: "./hayabusa-sample-evtx/YamatoSecurity/T1027.004_Obfuscated Files or Information\u{a0}Compile After Delivery/sysmon.evtx"
1 / 509 [>-------------------------------------------------------------------------------------------------------------------------------------------] 0.20 % 1s
Checking target evtx FilePath: "./hayabusa-sample-evtx/YamatoSecurity/T1558.004_Steal or Forge Kerberos Tickets AS-REP Roasting/Security.evtx"
2 / 509 [>-------------------------------------------------------------------------------------------------------------------------------------------] 0.39 % 1s
Checking target evtx FilePath: "./hayabusa-sample-evtx/YamatoSecurity/T1558.003_Steal or Forge Kerberos Tickets\u{a0}Kerberoasting/Security.evtx"
3 / 509 [>-------------------------------------------------------------------------------------------------------------------------------------------] 0.59 % 1s
Checking target evtx FilePath: "./hayabusa-sample-evtx/YamatoSecurity/T1197_BITS Jobs/Windows-BitsClient.evtx"
4 / 509 [=>------------------------------------------------------------------------------------------------------------------------------------------] 0.79 % 1s
Checking target evtx FilePath: "./hayabusa-sample-evtx/YamatoSecurity/T1218.004_Signed Binary Proxy Execution\u{a0}InstallUtil/sysmon.evtx"
5 / 509 [=>------------------------------------------------------------------------------------------------------------------------------------------] 0.98 % 1s- Output to a CSV format compatible to import into Timesketch:
hayabusa-1.6.0-win-x64.exe -d ../hayabusa-sample-evtx --RFC-3339 -o timesketch-import.csv -P timesketch -U- Quiet error mode:
By default, hayabusa will save error messages to error log files.
If you do not want to save error messages, please add
-Q.
You can use the -p or --pivot-keywords-list option to create a list of unique pivot keywords to quickly identify abnormal users, hostnames, processes, etc... as well as correlate events. You can customize what keywords you want to search for by editing ./config/pivot_keywords.txt.
This is the default setting:
Users.SubjectUserName
Users.TargetUserName
Users.User
Logon IDs.SubjectLogonId
Logon IDs.TargetLogonId
Workstation Names.WorkstationName
Ip Addresses.IpAddress
Processes.Image
The format is KeywordName.FieldName. For example, when creating the list of Users, hayabusa will list up all the values in the SubjectUserName, TargetUserName and User fields. By default, hayabusa will return results from all events (informational and higher) so we highly recommend combining the --pivot-keyword-list option with the -m or --min-level option. For example, start off with only creating keywords from critical alerts with -m critical and then continue with -m high, -m medium, etc... There will most likely be common keywords in your results that will match on many normal events, so after manually checking the results and creating a list of unique keywords in a single file, you can then create a narrowed down timeline of suspicious activity with a command like grep -f keywords.txt timeline.csv.
You can use the -L or --logon-summary option to output logon information summary (logon usernames and successful and failed logon count).
You can display the logon information for one evtx file with -f or multiple evtx files with the -d option.
We have provided some sample evtx files for you to test hayabusa and/or create new rules at https://github.com/Yamato-Security/hayabusa-sample-evtx
You can download the sample evtx files to a new hayabusa-sample-evtx sub-directory with the following command:
git clone https://github.com/Yamato-Security/hayabusa-sample-evtx.gitHayabusa has 5 pre-defined profiles to use in config/profiles.yaml:
minimalstandard(default)verboseall-field-infoall-field-info-verbosesuper-verbosetimesketch-minimaltimesketch-verbose
You can easily customize or add your own profiles by editing this file.
You can also easily change the default profile with --set-default-profile <profile>.
%Timestamp%, %Computer%, %Channel%, %EventID%, %Level%, %RuleTitle%, %Details%
%Timestamp%, %Computer%, %Channel%, %EventID%, %Level%, %RecordID%, %RuleTitle%, %Details%
%Timestamp%, %Computer%, %Channel%, %EventID%, %Level%, %MitreTactics, %MitreTags%, %OtherTags%, %RecordID%, %RuleTitle%, %Details%, %RuleFile%, %EvtxFile%
Instead of outputting the minimal details information, all field information in the EventData section will be outputted.
%Timestamp%, %Computer%, %Channel%, %EventID%, %Level%, %RecordID%, %RuleTitle%, %AllFieldInfo%, %RuleFile%, %EvtxFile%
all-field-info profile plus tag information.
%Timestamp%, %Computer%, %Channel%, %EventID%, %Level%, %MitreTactics, %MitreTags%, %OtherTags%, %RecordID%, %RuleTitle%, %AllFieldInfo%, %RuleFile%, %EvtxFile%
verbose profile plus all field information. (Warning: this will usually double the output file size!)
%Timestamp%, %Computer%, %Channel%, %EventID%, %Level%, %MitreTactics, %MitreTags%, %OtherTags%, %RecordID%, %RuleTitle%, %Details%, %RuleFile%, %EvtxFile%, %AllFieldInfo%
The verbose profile that is compatible with importing into Timesketch.
%Timestamp%, hayabusa, %RuleTitle%, %Computer%, %Channel%, %EventID%, %Level%, %MitreTactics, %MitreTags%, %OtherTags%, %RecordID%, %Details%, %RuleFile%, %EvtxFile%
The super-verbose profile that is compatible with importing into Timesketch.
%Timestamp%, hayabusa, %RuleTitle%, %Computer%, %Channel%, %EventID%, %Level%, %MitreTactics, %MitreTags%, %OtherTags%, %RecordID%, %Details%, %RuleFile%, %EvtxFile%, %AllFieldInfo%
The following benchmarks were conducted on a 2018 MBP with 7.5GB of evtx data.
| Profile | Processing Time | Output Filesize |
|---|---|---|
| minimal | 16 minutes 18 seconds | 690 MB |
| standard | 16 minutes 23 seconds | 710 MB |
| verbose | 17 minutes | 990 MB |
| timesketch-minimal | 17 minutes | 1015 MB |
| all-field-info-verbose | 16 minutes 50 seconds | 1.6 GB |
| super-verbose | 17 minutes 12 seconds | 2.1 GB |
| Alias name | Hayabusa output information |
|---|---|
| %Timestamp% | Default is YYYY-MM-DD HH:mm:ss.sss +hh:mm format. <Event><System><TimeCreated SystemTime> field in the event log. The default timezone will be the local timezone but you can change the timezone to UTC with the --UTC option. |
| %Computer% | The <Event><System><Computer> field. |
| %Channel% | The name of log. <Event><System><Channel> field. |
| %EventID% | The <Event><System><EventID> field. |
| %Level% | The level field in the YML detection rule. (informational, low, medium, high, critical) |
| %MitreTactics% | MITRE ATT&CK tactics (Ex: Initial Access, Lateral Movement, etc...). |
| %MitreTags% | MITRE ATT&CK Group ID, Technique ID and Software ID. |
| %OtherTags% | Any keyword in the tags field in a YML detection rule which is not included in MitreTactics or MitreTags. |
| %RecordID% | The Event Record ID from <Event><System><EventRecordID> field. |
| %RuleTitle% | The title field in the YML detection rule. |
| %Details% | The details field in the YML detection rule, however, only hayabusa rules have this field. This field gives extra information about the alert or event and can extract useful data from the fields in event logs. For example, usernames, command line information, process information, etc... When a placeholder points to a field that does not exist or there is an incorrect alias mapping, it will be outputted as n/a (not available). If the details field is not specified (i.e. sigma rules), default details messages to extract fields defined in ./rules/config/default_details.txt will be outputted. You can add more default details messages by adding the Provider Name, EventID and details message you want to output in default_details.txt. When no details field is defined in a rule nor in default_details.txt, all fields will be outputted to the details column. |
| %AllFieldInfo% | All field information. |
| %RuleFile% | The filename of the detection rule that generated the alert or event. |
| %EvtxFile% | The evtx filename that caused the alert or event. |
You can use these aliases in your output profiles, as well as define other event key alises to output other fields.
In order to save space, we use the following abbrevations when displaying the alert level.
crit:criticalhigh:highmed:medlow:lowinfo:informational
In order to save space, we use the following abbreviations when displaying MITRE ATT&CK tactic tags.
You can freely edit these abbreviations in the ./config/output_tag.txt configuration file.
If you want to output all the tags defined in a rule, please specify the --all-tags option.
Recon: ReconnaissanceResDev: Resource DevelopmentInitAccess: Initial AccessExec: ExecutionPersis: PersistencePrivEsc: Privilege EscalationEvas: Defense EvasionCredAccess: Credential AccessDisc: DiscoveryLatMov: Lateral MovementCollect: CollectionC2: Command and ControlExfil: ExfiltrationImpact: Impact
In order to save space, we use the following abbreviations when displaying Channel.
You can freely edit these abbreviations in the ./rules/config/channel_abbreviations.txt configuration file.
App:ApplicationAppLocker:Microsoft-Windows-AppLocker/*BitsCli:Microsoft-Windows-Bits-Client/OperationalCodeInteg:Microsoft-Windows-CodeIntegrity/OperationalDefender:Microsoft-Windows-Windows Defender/OperationalDHCP-Svr:Microsoft-Windows-DHCP-Server/OperationalDNS-Svr:DNS ServerDvrFmwk:Microsoft-Windows-DriverFrameworks-UserMode/OperationalExchange:MSExchange ManagementFirewall:Microsoft-Windows-Windows Firewall With Advanced Security/FirewallKeyMgtSvc:Key Management ServiceLDAP-Cli:Microsoft-Windows-LDAP-Client/DebugNTLMMicrosoft-Windows-NTLM/OperationalOpenSSH:OpenSSH/OperationalPrintAdm:Microsoft-Windows-PrintService/AdminPrintOp:Microsoft-Windows-PrintService/OperationalPwSh:Microsoft-Windows-PowerShell/OperationalPwShClassic:Windows PowerShellRDP-Client:Microsoft-Windows-TerminalServices-RDPClient/OperationalSec:SecuritySecMitig:Microsoft-Windows-Security-Mitigations/*SmbCliSec:Microsoft-Windows-SmbClient/SecuritySvcBusCli:Microsoft-ServiceBus-ClientSys:SystemSysmon:Microsoft-Windows-Sysmon/OperationalTaskSch:Microsoft-Windows-TaskScheduler/OperationalWinRM:Microsoft-Windows-WinRM/OperationalWMI:Microsoft-Windows-WMI-Activity/Operational
The following abbreviations are used in rules in order to make the output as concise as possible:
Acct-> AccountAddr-> AddressAuth-> AuthenticationCli-> ClientCmd-> CommandComp-> ComputerConn-> ConnectionDir-> DirectoryDst-> DestinationExec-> ExecutionGrp-> GroupLID-> Logon IDNet-> NetworkObj-> ObjectProto-> ProtocolSig-> SignatureSusp-> SuspiciousSrc-> SourceSvc-> ServiceSvr-> ServerTgt-> TargetOp-> OperationPkg-> PackagePriv-> PrivilegeProc-> ProcessPID-> Process IDPGUID-> Process GUID (Global Unique ID)Ver-> Version
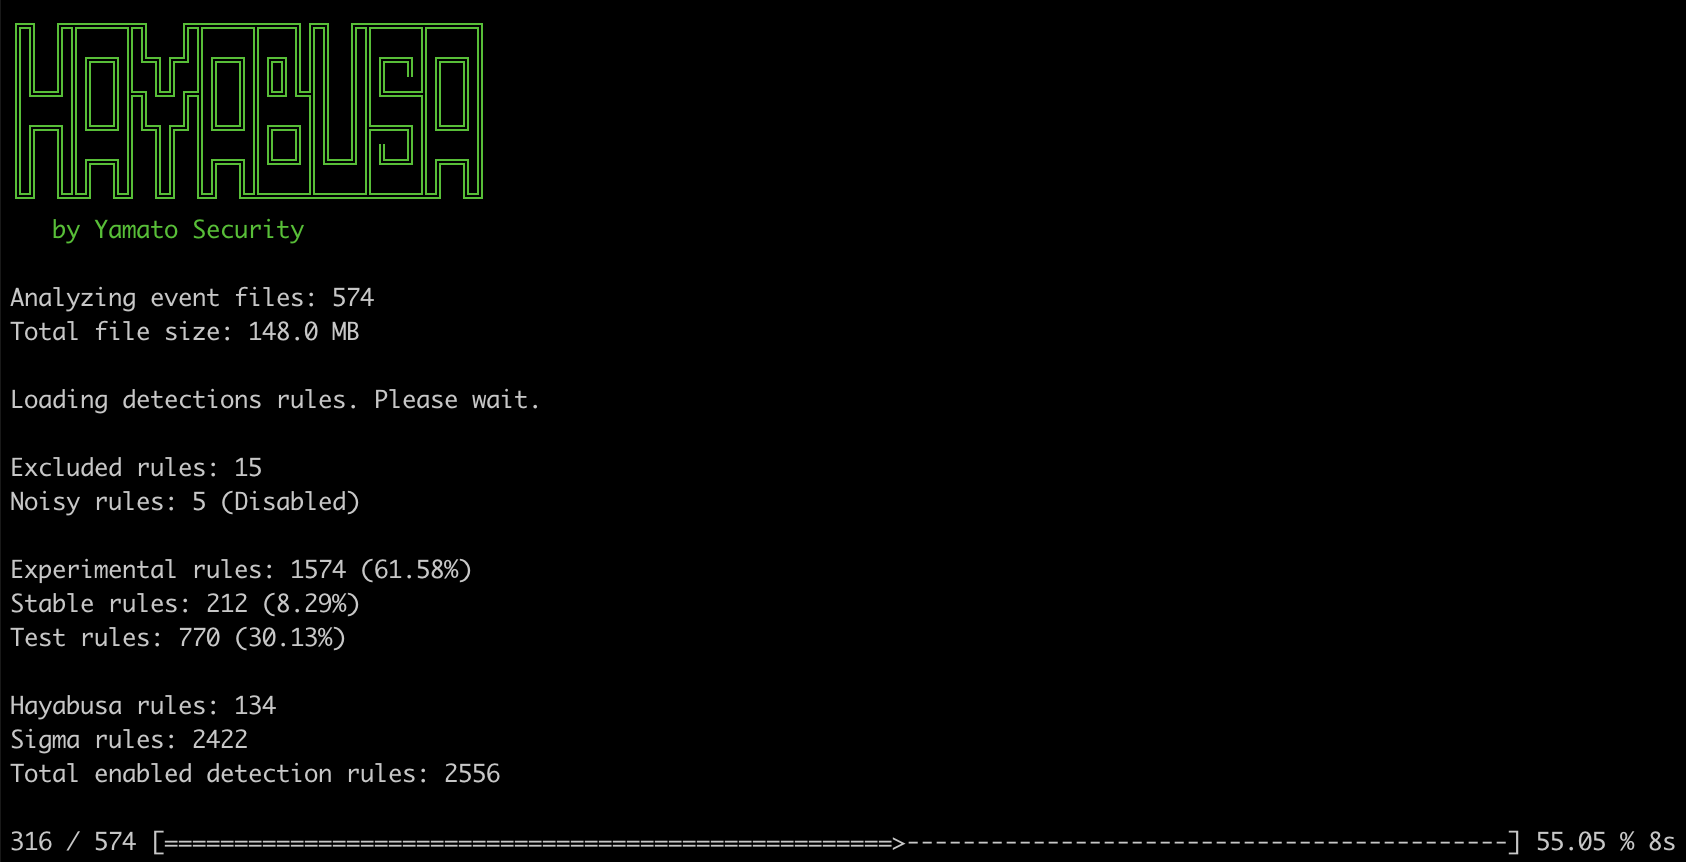
The progress bar will only work with multiple evtx files. It will display in real time the number and percent of evtx files that it has finished analyzing.
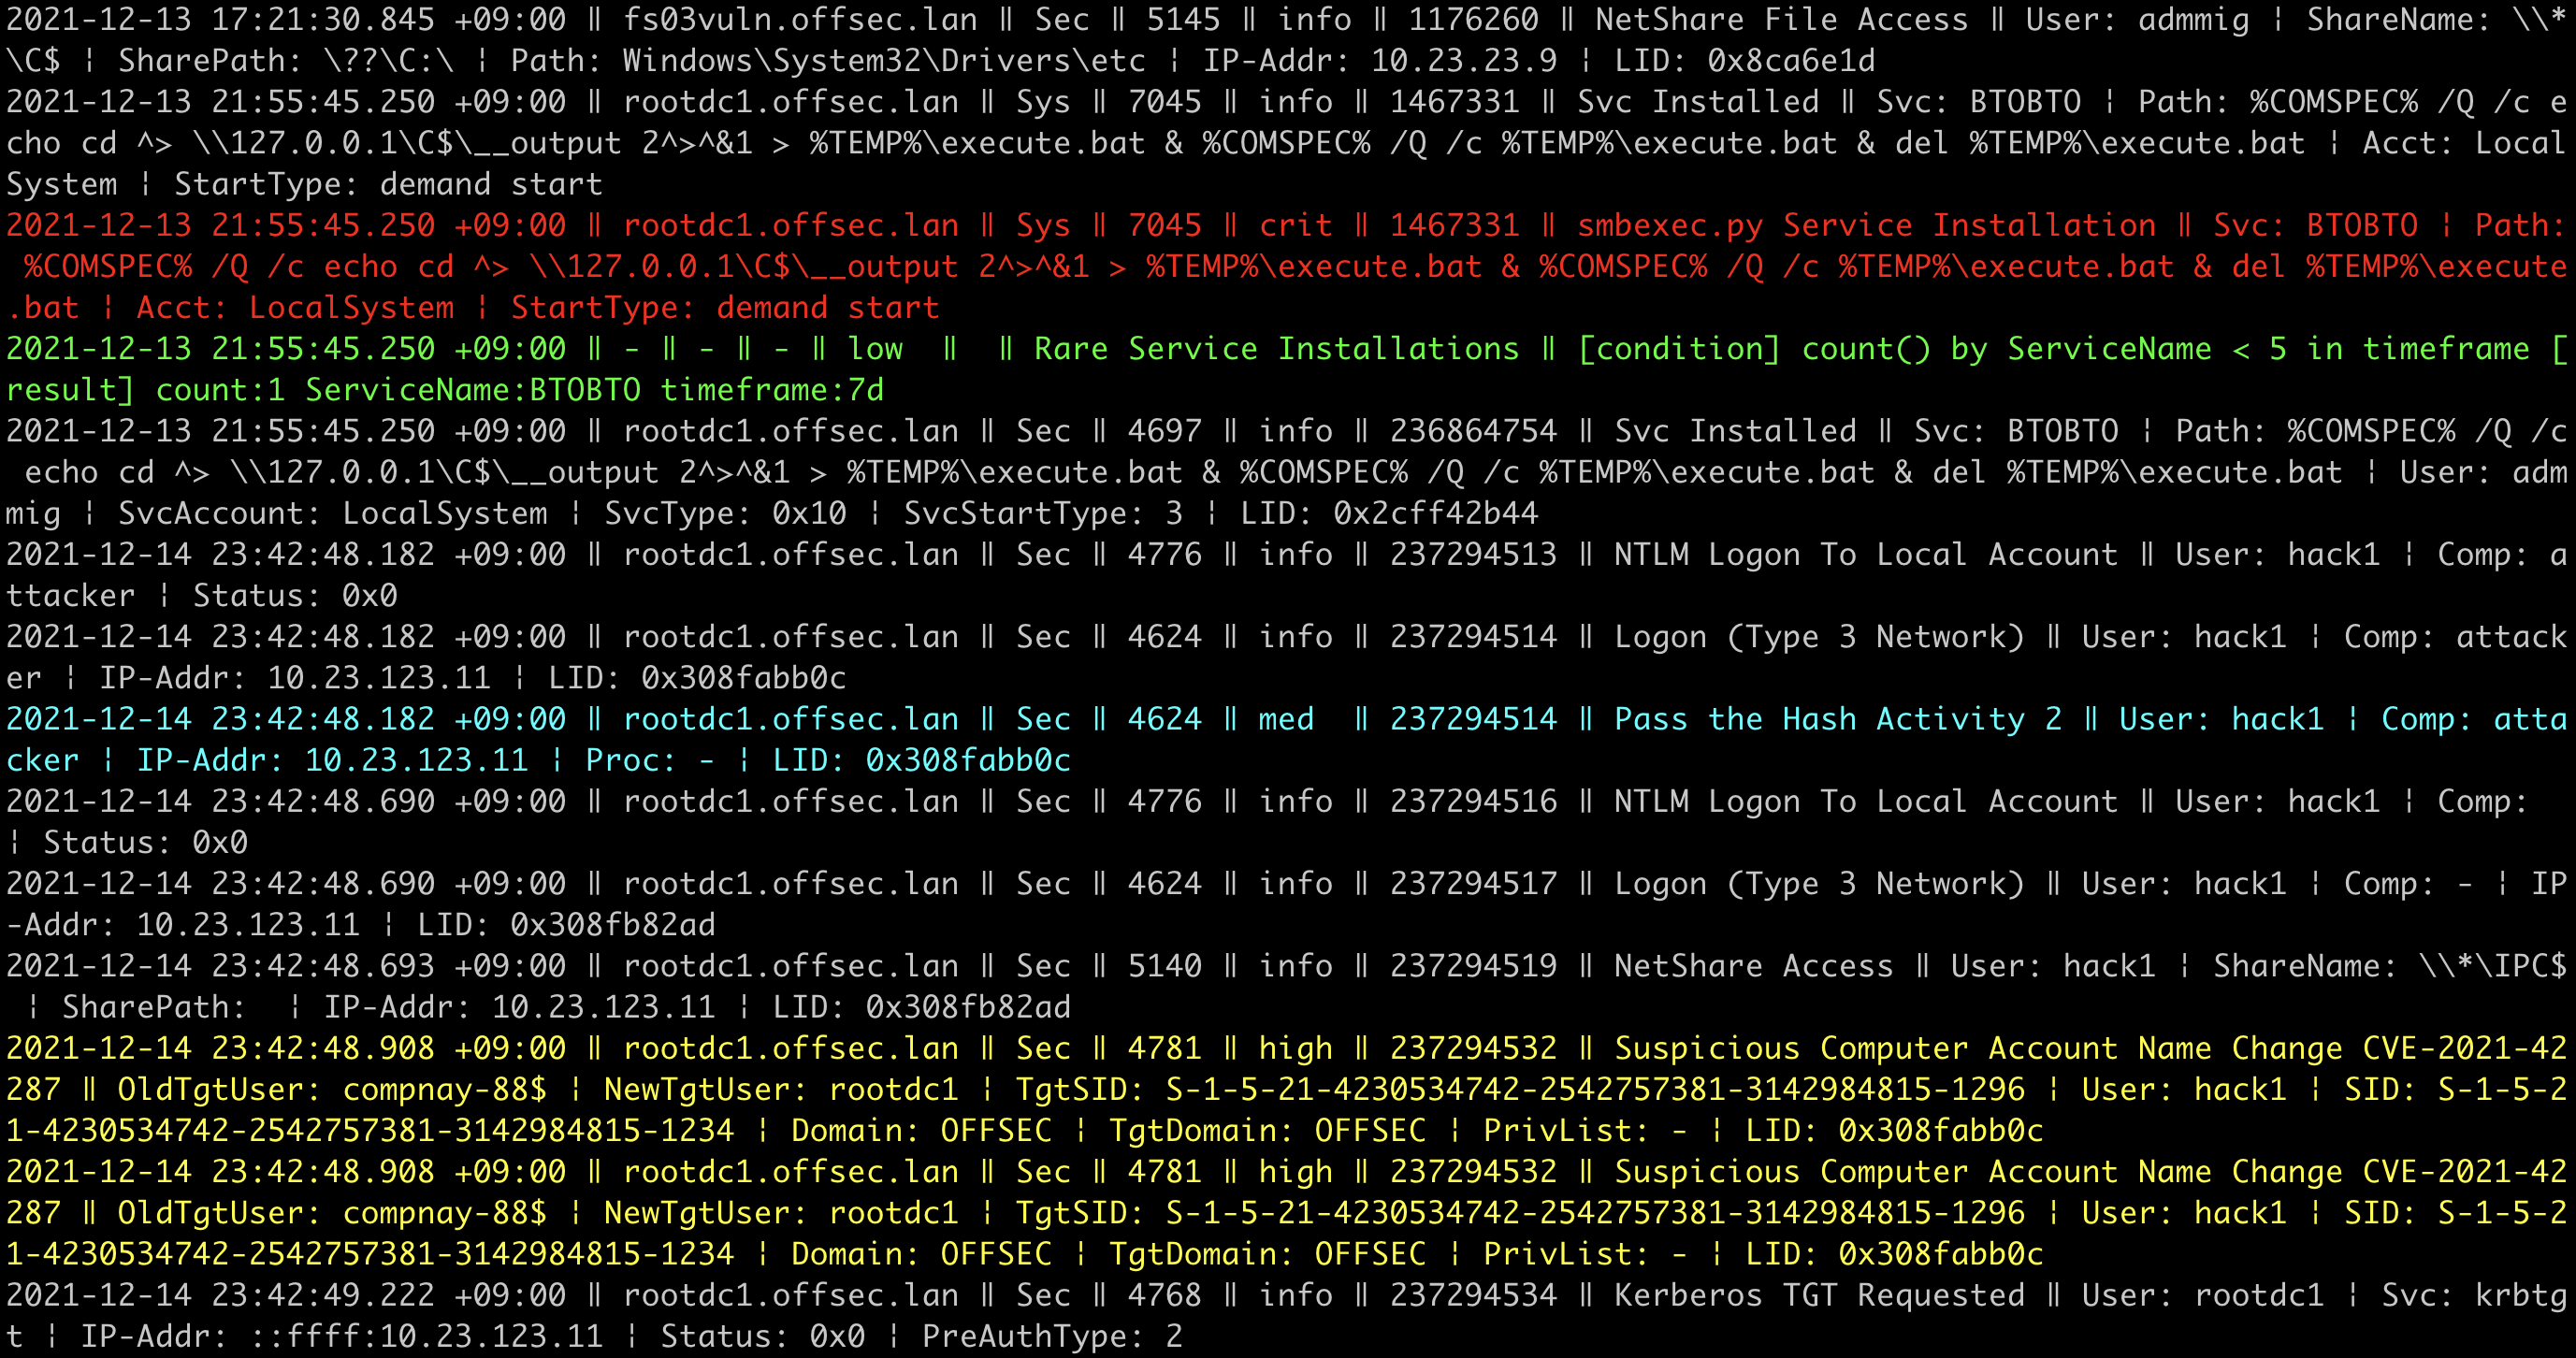
The alerts will be outputted in color based on the alert level.
You can change the default colors in the config file at ./config/level_color.txt in the format of level,(RGB 6-digit ColorHex).
If you want to disable color output, you can use --no-color option.
If you add -V or --visualize-timeline option, the Event Frequency Timeline feature displays a sparkline frequency timeline of detected events.
Note: There needs to be more than 5 events. Also, the characters will not render correctly on the default Command Prompt or PowerShell Prompt, so please use a terminal like Windows Terminal, iTerm2, etc...
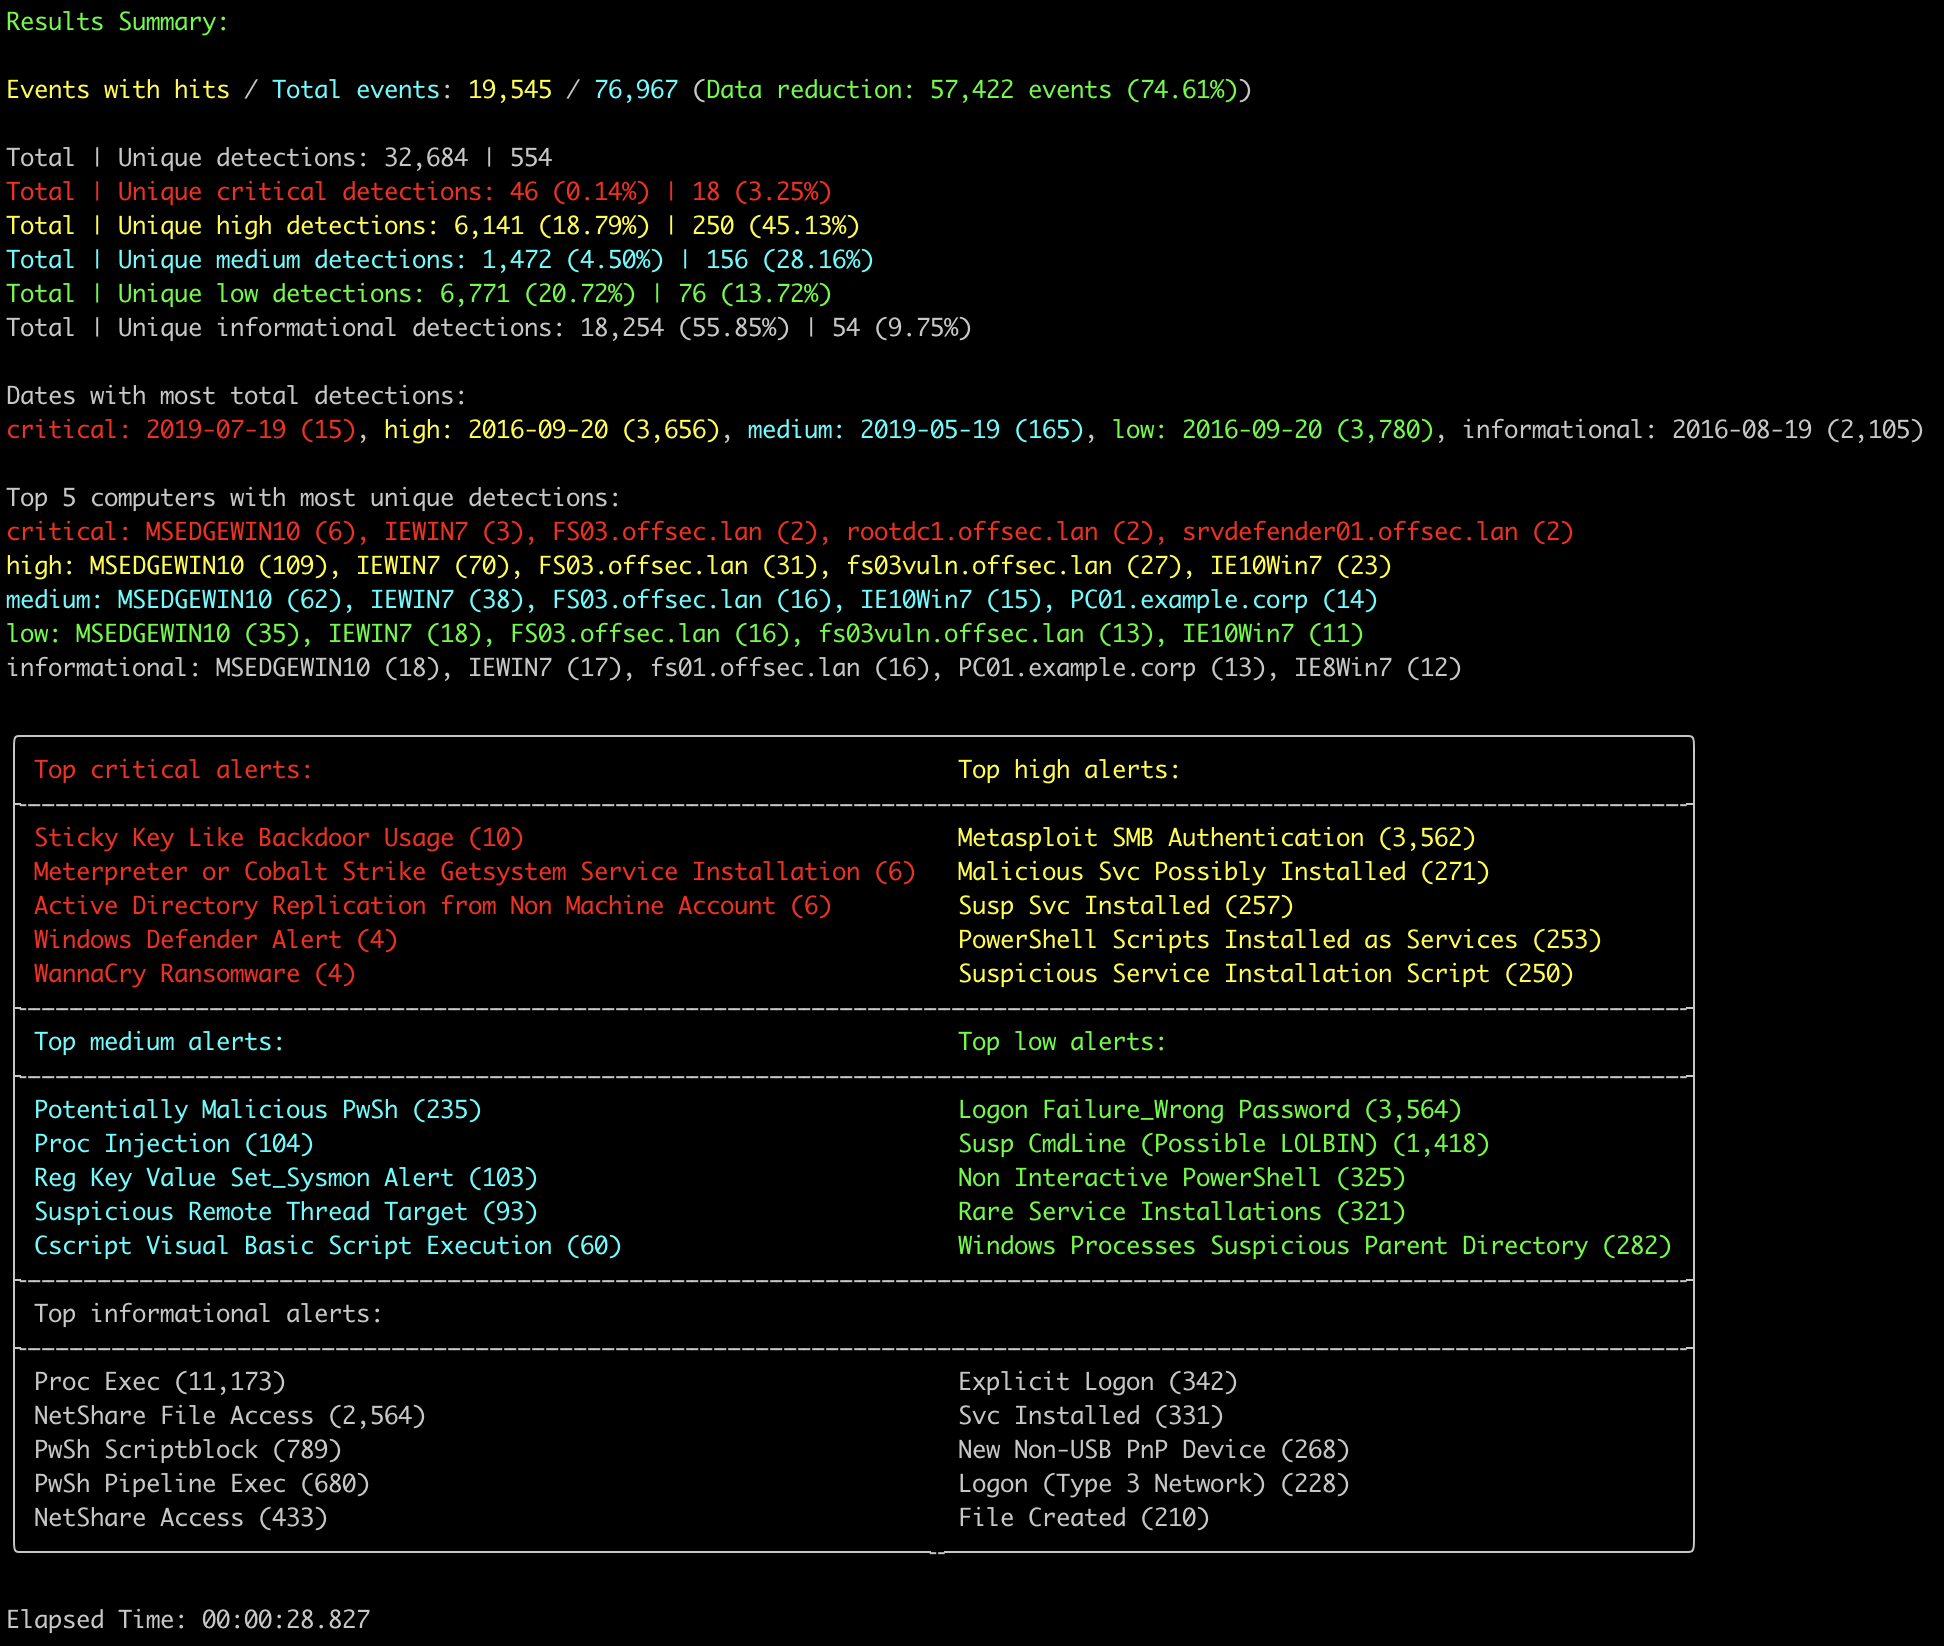
A summary of the dates with the most total detections categorized by level (critical, high, etc...).
The top 5 computers with the most unique detections categorized by level (critical, high, etc...).
Hayabusa detection rules are written in a sigma-like YML format and are located in the rules folder. In the future, we plan to host the rules at https://github.com/Yamato-Security/hayabusa-rules so please send any issues and pull requests for rules there instead of the main hayabusa repository.
Please read the hayabusa-rules repository README to understand about the rule format and how to create rules.
All of the rules from the hayabusa-rules repository should be placed in the rules folder.
informational level rules are considered events, while anything with a level of low and higher are considered alerts.
The hayabusa rule directory structure is separated into 3 directories:
default: logs that are turned on in Windows by default.non-default: logs that need to be turned on through group policy, security baselines, etc...sysmon: logs that are generated by sysmon.testing: a temporary directory to put rules that you are currently testing.
Rules are further seperated into directories by log type (Example: Security, System, etc...) and are named in the following format:
- Alert format:
<EventID>_<EventDescription>_<AttackDescription>.yml - Alert example:
1102_SecurityLogCleared_PossibleAntiForensics.yml - Event format:
<EventID>_<EventDescription>.yml - Event example:
4776_NTLM-LogonToLocalAccount.yml
Please check out the current rules to use as a template in creating new ones or for checking the detection logic.
Sigma rules need to first be converted to hayabusa rule format explained here. Almost all hayabusa rules are compatible with the sigma format so you can use them just like sigma rules to convert to other SIEM formats. Hayabusa rules are designed solely for Windows event log analysis and have the following benefits:
- An extra
detailsfield to display additional information taken from only the useful fields in the log. - They are all tested against sample logs and are known to work.
Some sigma rules may not work as intended due to bugs in the conversion process, unsupported features, or differences in implementation (such as in regular expressions).
- Extra aggregators not found in sigma, such as
|equalsfield.
Limitations: To our knowledge, hayabusa provides the greatest support for sigma rules out of any open source Windows event log analysis tool, however, there are still rules that are not supported:
- Rules that use regular expressions that do not work with the Rust regex crate
- Aggregation expressions besides
countin the sigma rule specification. - Rules that use
|near.
Like firewalls and IDSes, any signature-based tool will require some tuning to fit your environment so you may need to permanently or temporarily exclude certain rules.
You can add a rule ID (Example: 4fe151c2-ecf9-4fae-95ae-b88ec9c2fca6) to ./rules/config/exclude_rules.txt in order to ignore any rule that you do not need or cannot be used.
You can also add a rule ID to ./rules/config/noisy_rules.txt in order to ignore the rule by default but still be able to use the rule with the -n or --enable-noisy-rules option.
Hayabusa and Sigma rule authors will determine the risk level of the alert when writing their rules.
However, the actual risk level will differ between environments.
You can tune the risk level of the rules by adding them to ./rules/config/level_tuning.txt and executing hayabusa-1.6.0-win-x64.exe --level-tuning which will update the level line in the rule file.
Please note that the rule file will be updated directly.
./rules/config/level_tuning.txt sample line:
id,new_level
00000000-0000-0000-0000-000000000000,informational # sample level tuning line
In this case, the risk level of the rule with an id of 00000000-0000-0000-0000-000000000000 in the rules directory will have its level rewritten to informational.
By default, events are filtered by ID to improve performance by ignorning events that have no detection rules.
The IDs defined in ./rules/config/target_event_IDs.txt will be scanned.
If you want to scan all events, please use the -D, --deep-scan option.
There is no "one tool to rule them all" and we have found that each has its own merits so we recommend checking out these other great tools and projects and seeing which ones you like.
- APT-Hunter - Attack detection tool written in Python.
- Awesome Event IDs - Collection of Event ID resources useful for Digital Forensics and Incident Response
- Chainsaw - Another sigma-based attack detection tool written in Rust.
- DeepBlueCLI - Attack detection tool written in Powershell by Eric Conrad.
- Epagneul - Graph visualization for Windows event logs.
- EventList - Map security baseline event IDs to MITRE ATT&CK by Miriam Wiesner.
- Mapping MITRE ATT&CK with Window Event Log IDs - by Michel de CREVOISIER
- EvtxECmd - Evtx parser by Eric Zimmerman.
- EVTXtract - Recover EVTX log files from unallocated space and memory images.
- EvtxToElk - Python tool to send Evtx data to Elastic Stack.
- EVTX ATTACK Samples - EVTX attack sample event log files by SBousseaden.
- EVTX-to-MITRE-Attack - EVTX attack sample event log files mapped to ATT&CK by Michel de CREVOISIER
- EVTX parser - the Rust evtx library we use written by @OBenamram.
- Grafiki - Sysmon and PowerShell log visualizer.
- LogonTracer - A graphical interface to visualize logons to detect lateral movement by JPCERTCC.
- RustyBlue - Rust port of DeepBlueCLI by Yamato Security.
- Sigma - Community based generic SIEM rules.
- SOF-ELK - A pre-packaged VM with Elastic Stack to import data for DFIR analysis by Phil Hagen
- so-import-evtx - Import evtx files into Security Onion.
- SysmonTools - Configuration and off-line log visualization tool for Sysmon.
- Timeline Explorer - The best CSV timeline analyzer by Eric Zimmerman.
- Windows Event Log Analysis - Analyst Reference - by Forward Defense's Steve Anson.
- WELA (Windows Event Log Analyzer) - The swiff-army knife for Windows event logs by Yamato Security
- Zircolite - Sigma-based attack detection tool written in Python.
In order to properly detect malicious activity on Windows machines, you will need to improve the default log settings. We recommend the following sites for guidance:
- JSCU-NL (Joint Sigint Cyber Unit Netherlands) Logging Essentials
- ACSC (Australian Cyber Security Centre) Logging and Fowarding Guide
- Malware Archaeology Cheat Sheets
To create the most forensic evidence and detect with the highest accuracy, you need to install sysmon. We recommend the following sites and config files:
- TrustedSec Sysmon Community Guide
- Sysmon Modular
- SwiftOnSecurity Sysmon Config
- SwiftOnSecurity Sysmon Config fork by Neo23x0
- SwiftOnSecurity Sysmon Config fork by ion-storm
- 2022/06/19 Velociraptor Walkthrough and Hayabusa Integration by Eric Capuano
- 2022/01/24 Graphing Hayabusa results in neo4j by Matthew Seyer (@forensic_matt)
- 2022/01/22 Visualizing Hayabusa results in Elastic Stack by @kzzzzo2
- 2021/12/31 Intro to Hayabusa by itiB (@itiB_S144)
- 2021/12/27 Hayabusa internals by Kazuminn (@k47_um1n)
We would love any form of contribution. Pull requests, rule creation and sample evtx logs are the best but feature requests, notifying us of bugs, etc... are also very welcome.
At the least, if you like our tool then please give us a star on Github and show your support!
Please submit any bugs you find here. This project is currently actively maintained and we are happy to fix any bugs reported.
If you find any issues (false positives, bugs, etc...) with Hayabusa rules, please report them to the hayabusa-rules github issues page here.
If you find any issues (false positives, bugs, etc...) with Sigma rules, please report them to the upstream SigmaHQ github issues page here.
Hayabusa is released under GPLv3 and all rules are released under the Detection Rule License (DRL) 1.1.
You can recieve the latest news about Hayabusa, rule updates, other Yamato Security tools, etc... by following us on Twitter at @SecurityYamato.


