Data_Visualization_Using_Python
The aim of this project is to collect, manipulate, visualize and analyze data taken from Kaggle.
Libraries used: -
- Numpy
Importing Numpy Library
About Numpy
Numpy is a library for the Python programming language, adding support for large, multi-dimensional arrays and matrices, along with a large collection of high-level mathematical functions to operate these arrays.
- Pandas
Importing Pandas Library
About Pandas
Pandas is a Python package providing fast, flexible, and expressive data structures designed to make working with “relational” or “labeled” data both easy and intuitive. It aims to be the fundamental high-level building block for doing practical, real-world data analysis in Python.
- Matplolib.pyplot
Importing Matplotlib.pyplot
About Matplotlib.pyplot
Matplotlib.pyplot is a collection of functions that make matplotlib work like MATLAB. Each pyplot function makes some change to a figure: e.g., creates a figure, creates a plotting area in a figure, plots some lines in a plotting area, decorates the plot with labels, etc.
- Sys Module
Importing Sys
About Sys
The python sys module provides functions and variables which are used to manipulate different parts of the Python Runtime Environment. It lets us access system-specific parameters and functions.
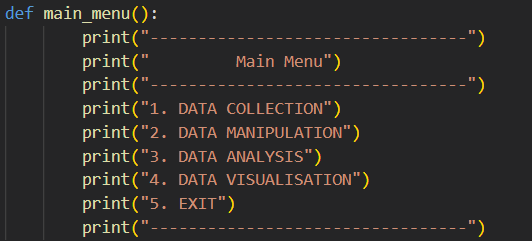
Various Menus Made: -
- For Data Collection
- For Data Manipulation
- For Updating Data
- For Sorting Data
- For Adding another dataframe
- For Data Analysis
Data Analysis
- Based on City v/s Total Literates


