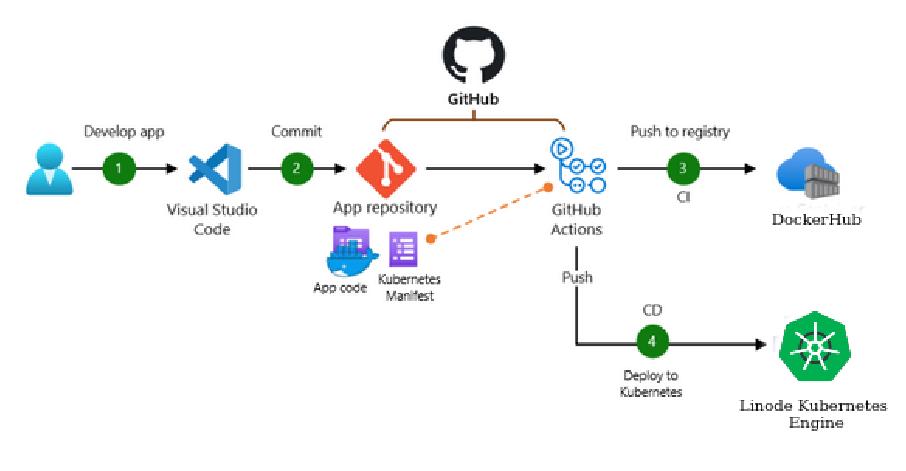
The site is live at http://143-42-79-74.ip.linodeusercontent.com/.
VaxHub is an online vaccination system where people can register using their name, address and NID. People can register for vaccination where they will get a vaccination date and they will go get a vaccine on that date. After getting the vaccination the user can apply for certificate and download it from the site.
This project utilizes Jest, Github Actions, Docker and Kubernetes for test automation, continuous integration and deployment.
- Prerequisites
- Installation
- Usage
- Testing
- Continuous Integration and Deployment
- Frontend
- Database
- Continuous Monitoring
- Autoscaling with Kubernetes on Linode
- Contributing
- License
Before getting started, ensure you have the following installed:
- Node.js
- Docker
- Kubernetes (for deployment)
To install the project locally, follow these steps:
- Clone the repository:
git clone https://github.com/risenfromashes/vaxhub.git
cd repository- Install the dependencies:
npm installTo run the project locally, execute the following command:
npm run devThis will start the application and make it accessible at http://localhost:3001.
This project uses Jest as the testing framework and Supertest for making HTTP requests to test the API endpoints. The test code is located in the tests directory.
To run the tests, use the following command:
npm testThis project utilizes GitHub Actions for automating the CI/CD pipeline. The workflow files are located in the .github/workflows directory.
The CI/CD pipeline includes the following steps:
-
Unit Testing: The unit tests are executed using Jest to verify the correctness of the code.
-
Build and Package: The application is built and packaged into a Docker image.
-
Containerization: The Docker image is pushed to the container registry to be deployed on Kubernetes.
To deploy the application using Docker and Kubernetes, follow these steps:
- Build the Docker image:
docker build -t your-image-name .- Push the Docker image to a container registry of your choice:
docker push your-registry/your-image-name:tag- Deploy the application on Kubernetes:
kubectl apply -f deployment.yamlEnsure that you have a valid deployment.yaml file with the necessary Kubernetes deployment configuration.
The frontend of this project is built using Svelte. Svelte is a modern JavaScript framework that compiles your code to highly efficient JavaScript code during the build process. The frontend code is located in the frontend directory.
To develop the frontend, follow these steps:
- Navigate to the frontend directory:
cd frontend- Install the frontend dependencies:
npm install- Run the frontend development server:
npm run devThe frontend server will be accessible at http://localhost:5000.
This project uses PostgreSQL as the database. To set up the database, follow these steps:
-
Install PostgreSQL on your local machine or use a hosted PostgreSQL service.
-
Create a new database.
-
Configure the database connection in your project's configuration file.
# Example configuration
DB_HOST=localhost
DB_PORT=5432
DB_USER=your-username
DB_PASSWORD=your-password
DB_DATABASE=your-database
Ensure that you replace the placeholder values (localhost, your-username, your-password, your-database) with your actual database details.
This project utilizes Prometheus and Grafana for continuous monitoring. Prometheus is a monitoring and alerting toolkit, while Grafana is a visualization tool for analyzing and monitoring metrics.
To set up continuous monitoring, follow these steps:
-
Install and configure Prometheus for scraping and storing metrics.
-
Set up Grafana and configure it to connect to Prometheus as a data source.
-
Import predefined dashboards or create custom dashboards in Grafana to visualize the metrics collected by Prometheus.
By setting up continuous monitoring with Prometheus and Grafana, you can monitor the performance, health, and other metrics of your application in real-time.
To handle autoscaling, this project utilizes Kubernetes on Linode. Kubernetes provides a robust container orchestration platform, and Linode offers a scalable infrastructure to host your Kubernetes cluster.
To set up autoscaling, follow these steps:
-
Create a Linode Kubernetes cluster.
-
Configure the autoscaling parameters such as minimum and maximum replica counts, target CPU or memory utilization, and scaling policies.
-
Deploy your application to the Kubernetes cluster and configure the autoscaling rules based on your application's performance metrics.
Kubernetes will automatically adjust the number of replicas based on the defined autoscaling rules, allowing your application to scale up or down based on demand.
Contributions are welcome! If you find any issues or have suggestions for improvement, please open an issue or submit a pull request.
This project is licensed under the MIT License.

