pip install rankyimport ranky as rkRead the documentation.
The main functionalities include scoring metrics (e.g. accuracy, roc auc), rank metrics (e.g. Kendall Tau, Spearman correlation), ranking systems (e.g. Majority judgement, Kemeny-Young method) and some measurements (e.g. Kendall's W coefficient of concordance).
Most functions takes as input 2-dimensional numpy.array or pandas.DataFrame objects. DataFrame are the best to keep track of the names of each data point.
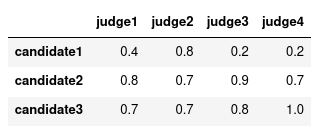
Let's consider the following preference matrix:
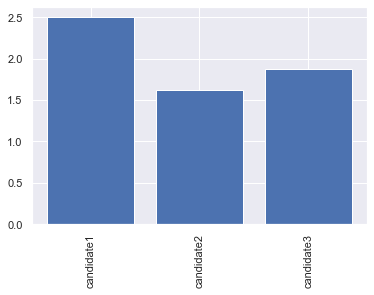
Each row is a candidate and each column is a judge. Here is the results of rk.borda(matrix), computing the mean rank of each candidate:
We can see that candidate2 has the best average rank among the four judges.
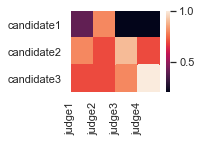
Let's display it using rk.show(rk.borda(matrix)):
The rank aggregation methods available include:
- Random Dictator:
rk.dictator(m) - Score Voting (mean):
rk.score(m) - Borda Count (average rank):
rk.borda(m) - Majority Judgement (median):
rk.majority(m) - Pairwise methods. Copeland's method:
rk.pairwise(m), Success rate:rk.pairwise(m, wins=rk.success_rate)and more. You can specify your own "wins" function or select one from therk.duelmodule. - Optimal rank aggregation using any rank metric:
rk.center(m),rk.center(m, method='kendalltau'). Solver used [1]. - (Kemeny-Young method is optimal rank aggregation using Kendall's tau as metric.)
- (Optimal rank aggregation using Spearman correlation as metric is equivalent to Borda count.)
You can use any_metric(a, b, method) to call a metric from any of the three categories below.
-
Scoring metrics:
rk.metric(y_true, y_pred, method='accuracy'). Methods include:['accuracy', 'balanced_accuracy', 'precision', 'average_precision', 'brier', 'f1_score', 'mxe', 'recall', 'jaccard', 'roc_auc', 'mse', 'rmse', 'sar'] -
Rank correlation coefficients:
rk.corr(r1, r2, method='spearman'). Methods include:['kendalltau', 'spearman', 'pearson'] -
Rank distances:
rk.dist(r1, r2, method='levenshtein'). Methods include:['hamming', 'levenshtein', 'winner', 'euclidean']
To add: general edit distances, kemeny distance, regression metrics...
- Use
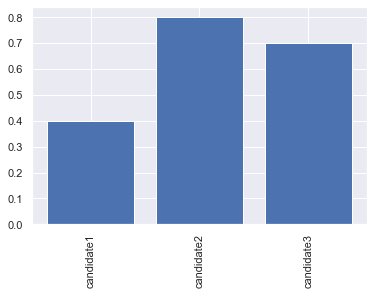
rk.showto visualize preference matrix (2D) or ranking ballots (1D).
>>> rk.show(m)
>>> rk.show(m['judge1'])
- Use
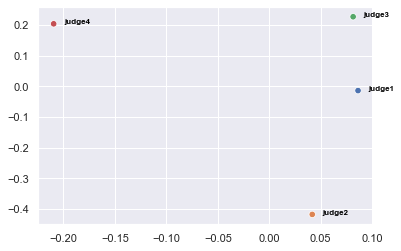
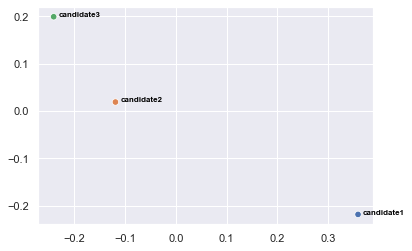
rk.mds, to visualize (in 2D or 3D) the points in a given metric space. Seerk.scatterplotdocumentation for display arguments.
>>> rk.mds(m, method='euclidean')
>>> rk.mds(m, method='spearman', axis=1)
- You can use
rk.tsnesimilarly tork.mds.
- Rank,
rk.rank, convert a 1D score ballot into a ranking. - Bootstrap,
rk.bootstrap, sample a given axis. - Consensus,
rk.consensus, check if ranking exactly agree. - Concordance, ,
rk.concordance, mean rank distance between all judges of a preference matrix. - Centrality,
rk.centrality, mean rank distance between a ranking and a preference matrix. - Kendall's W,
rk.kendall_w, coefficient of concordance. - Utility:
read_codalab_csvto parse a CSV generated by Codalab representing a leaderboard into apandas.DataFrame.
Please cite ranky in your publications if this is useful for your research. Here is an example BibTeX entry:
@misc{pavao2020ranky,
  title={ranky},
  author={Adrien Pavao},
  year={2020},
  howpublished={\url{https://github.com/didayolo/ranky}},
}
[1] Storn R. and Price K., Differential Evolution - a Simple and Efficient Heuristic for Global Optimization over Continuous Spaces, Journal of Global Optimization, 1997, 11, 341 - 359.

