Most universities have what is named as an academic concentration, which is a branch of an academic major. This includes the Informatics Major in Universitas Pelita Harapan. Choosing the right academic concentration is very important, as it determines the main focus for students to learn on for more than half of their university lifetime.
Unfortunately, there is little information available to help students decide their concentration. Considering the fact that students also strive for academic success, this application tries to give an insight to help them choose the right concentration. Given a list of course scores for the first four semesters, the student will be given the predicted rate of success for each Informatics major concentration.
To run this app, make sure you have the mentioned prerequisites and follow the installation steps below.
Before installing any libraries, it is better to have a clean slate Python environment. To do so, we can make a Python virtual environment by running:
python3 -m venv myvenvThe command above will create a directory called myvenv in the project root. To activate the virtual environment, run the following command:
# For Windows users
$ .\myvenv\Scripts\activate.bat

# For UNIX or MacOS
$ source myvenv/bin/activate
Your terminal prompt will be prepended by the name of the virtual environment. For instance, activating myvenv would cause the terminal to look like this:
$ source myvenv/bin/activate
(myvenv) $ _
Make sure the virtual environment is already activated
There are several libraries used for this project, all of them are listed in requirements.txt. To install all of them, simply run the following command from the project directory.
(myvenv) $ pip install -r requirements.txtIF, however, you want to install the libraries manually, here are the links to the crucial ones:
Make sure the virtual environment is still activated
The app was built using Dash. To run the app locally, run the following command from the project root directory:
(myvenv) $ python main.py
Running on http://127.0.0.1:8050/
Debugger PIN: XXX-XXX-XXX
 * Serving Flask app "main" (lazy loading)
 * Environment: production
   WARNING: This is a development server. Do not use it in a production deployment.
   Use a production WSGI server instead.
 * Debug mode: on
Running on http://127.0.0.1:8050/
Debugger PIN: XXX-XXX-XXX
...
You can open the app on the browser by accessing http://127.0.0.1:8050/.
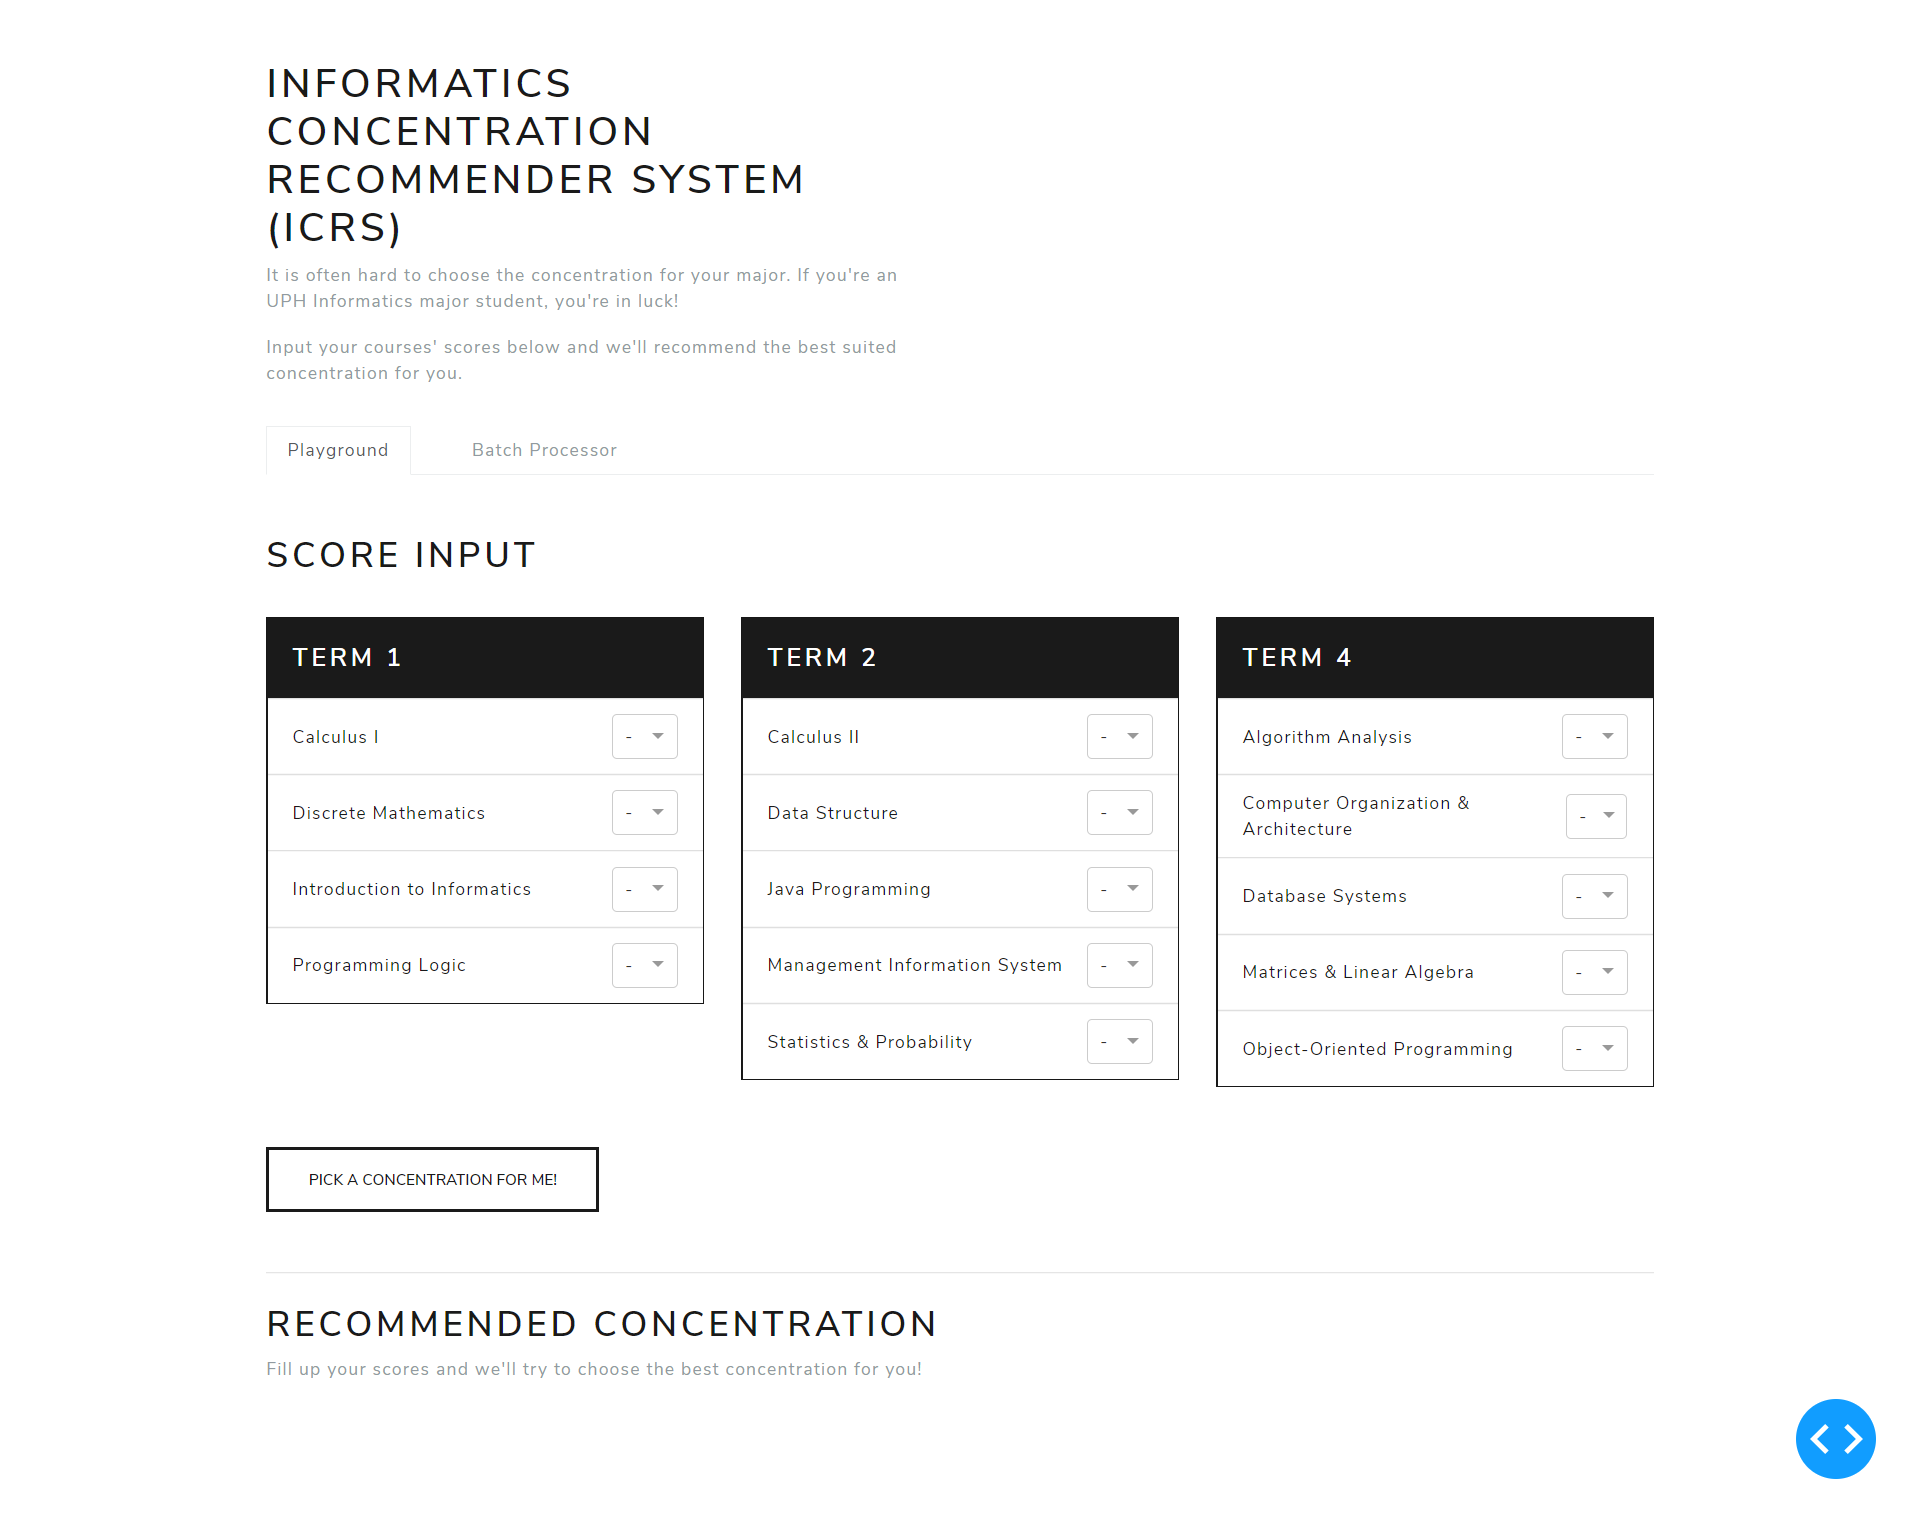
You will be greeted with a screen similar like the image below.
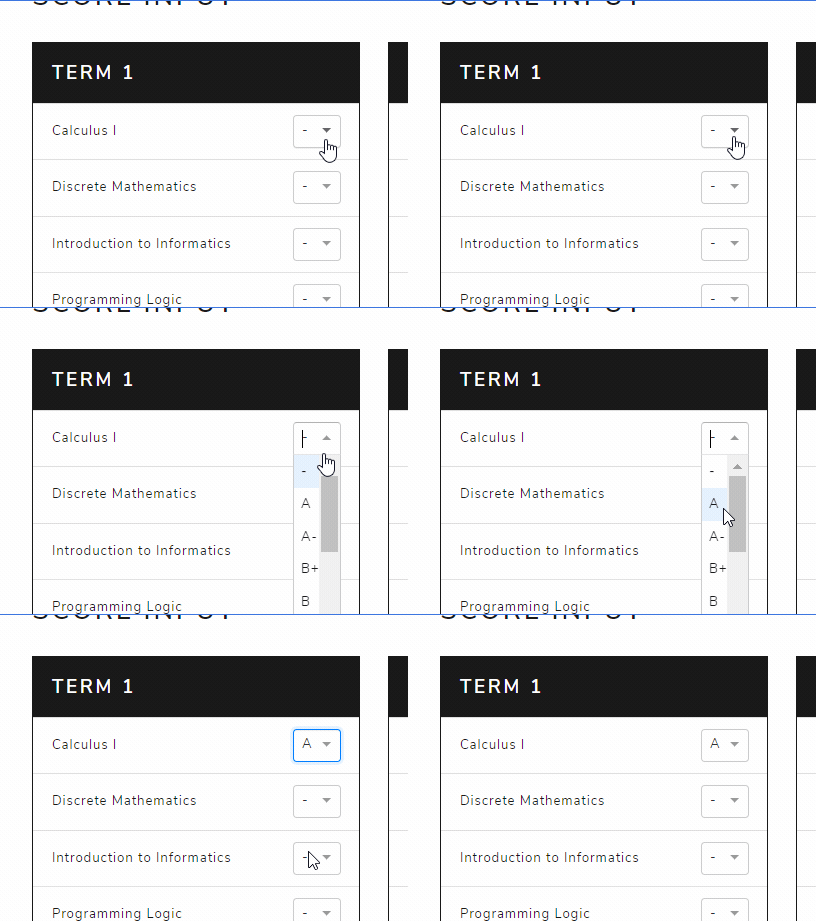
Here, you can manually input scores yourself by using the available dropdowns.
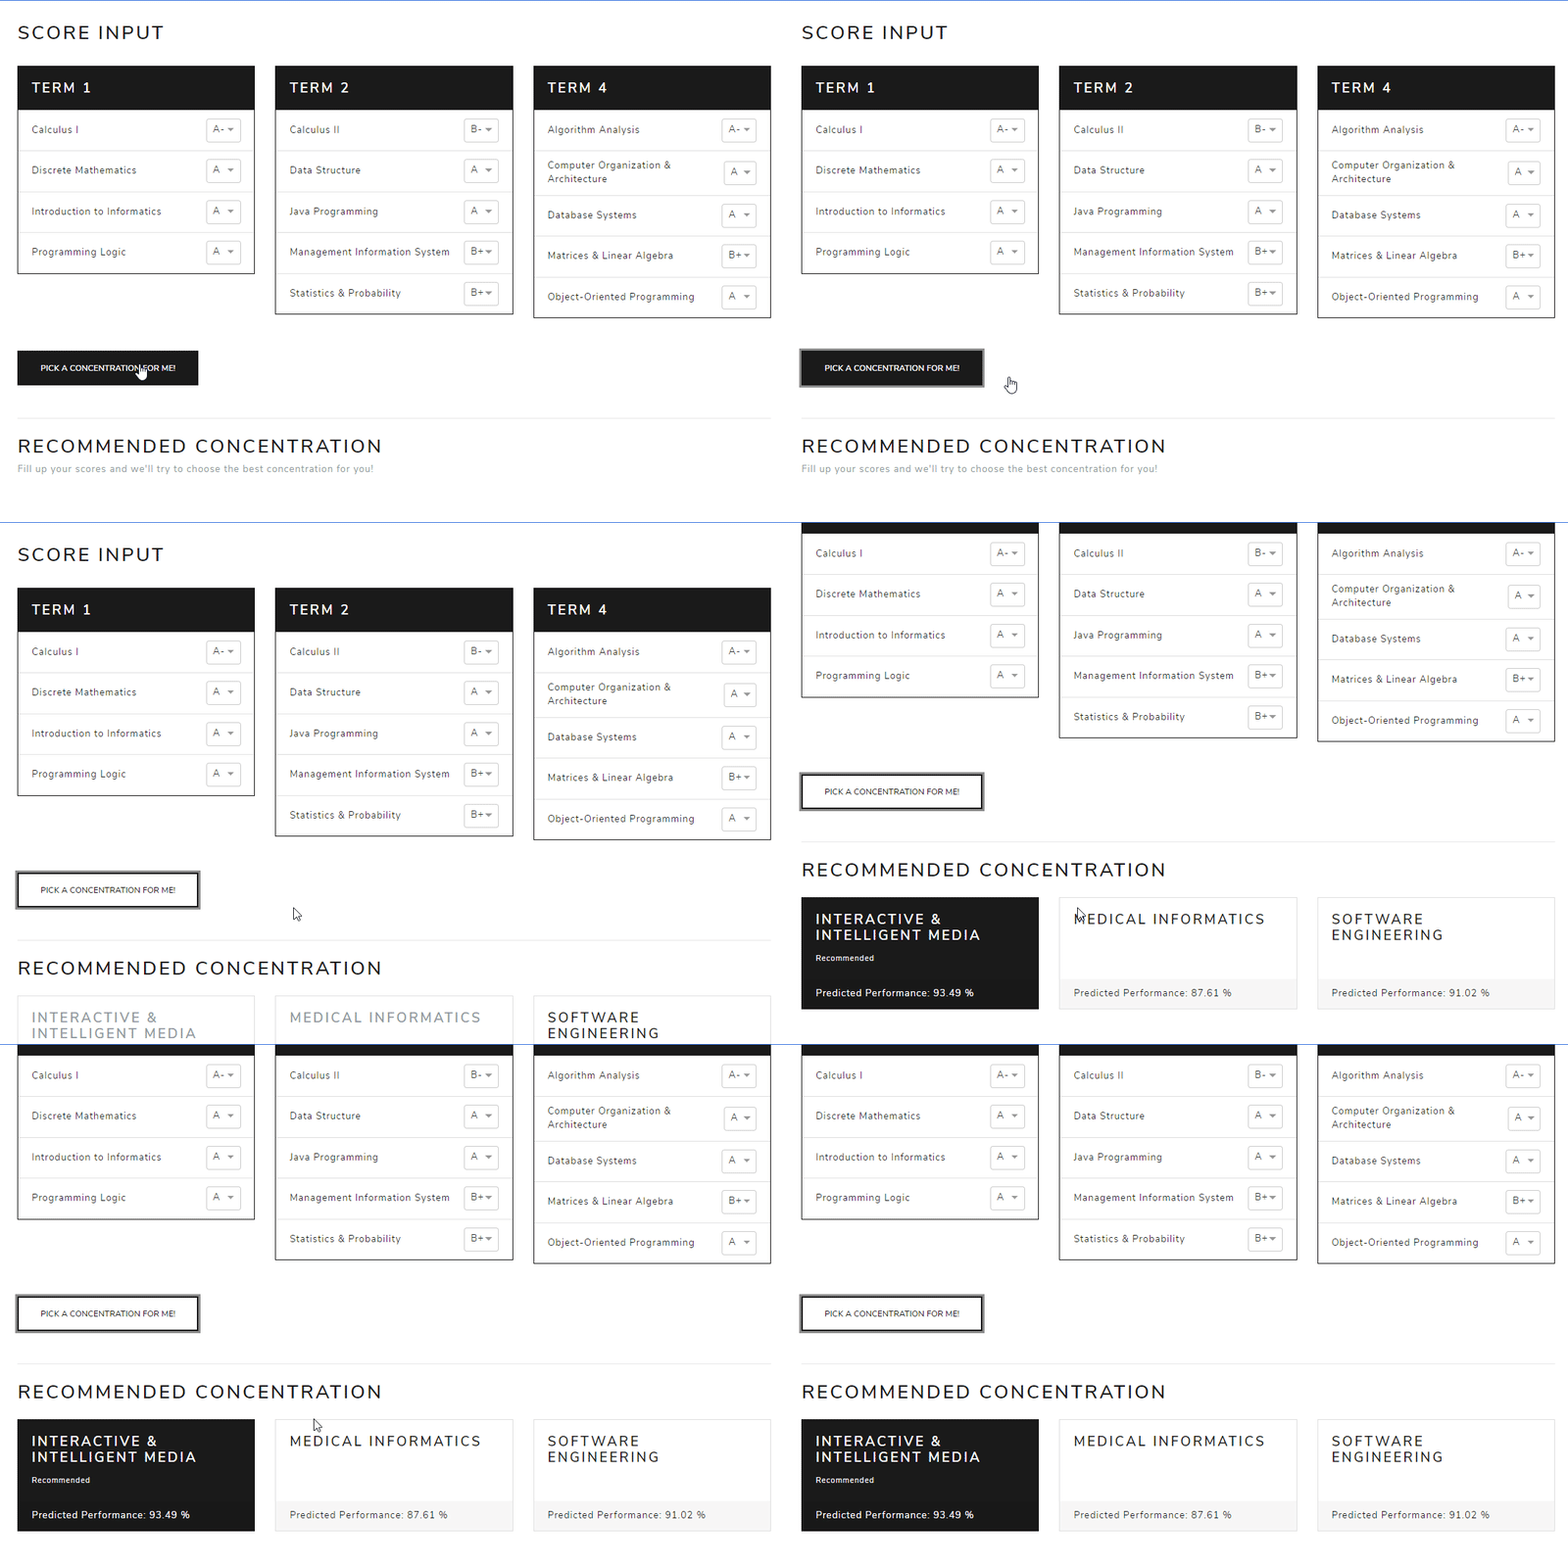
Once finished, you can click the button labeled "Pick a concentration for me!" to output the prediction. It will output something like this:
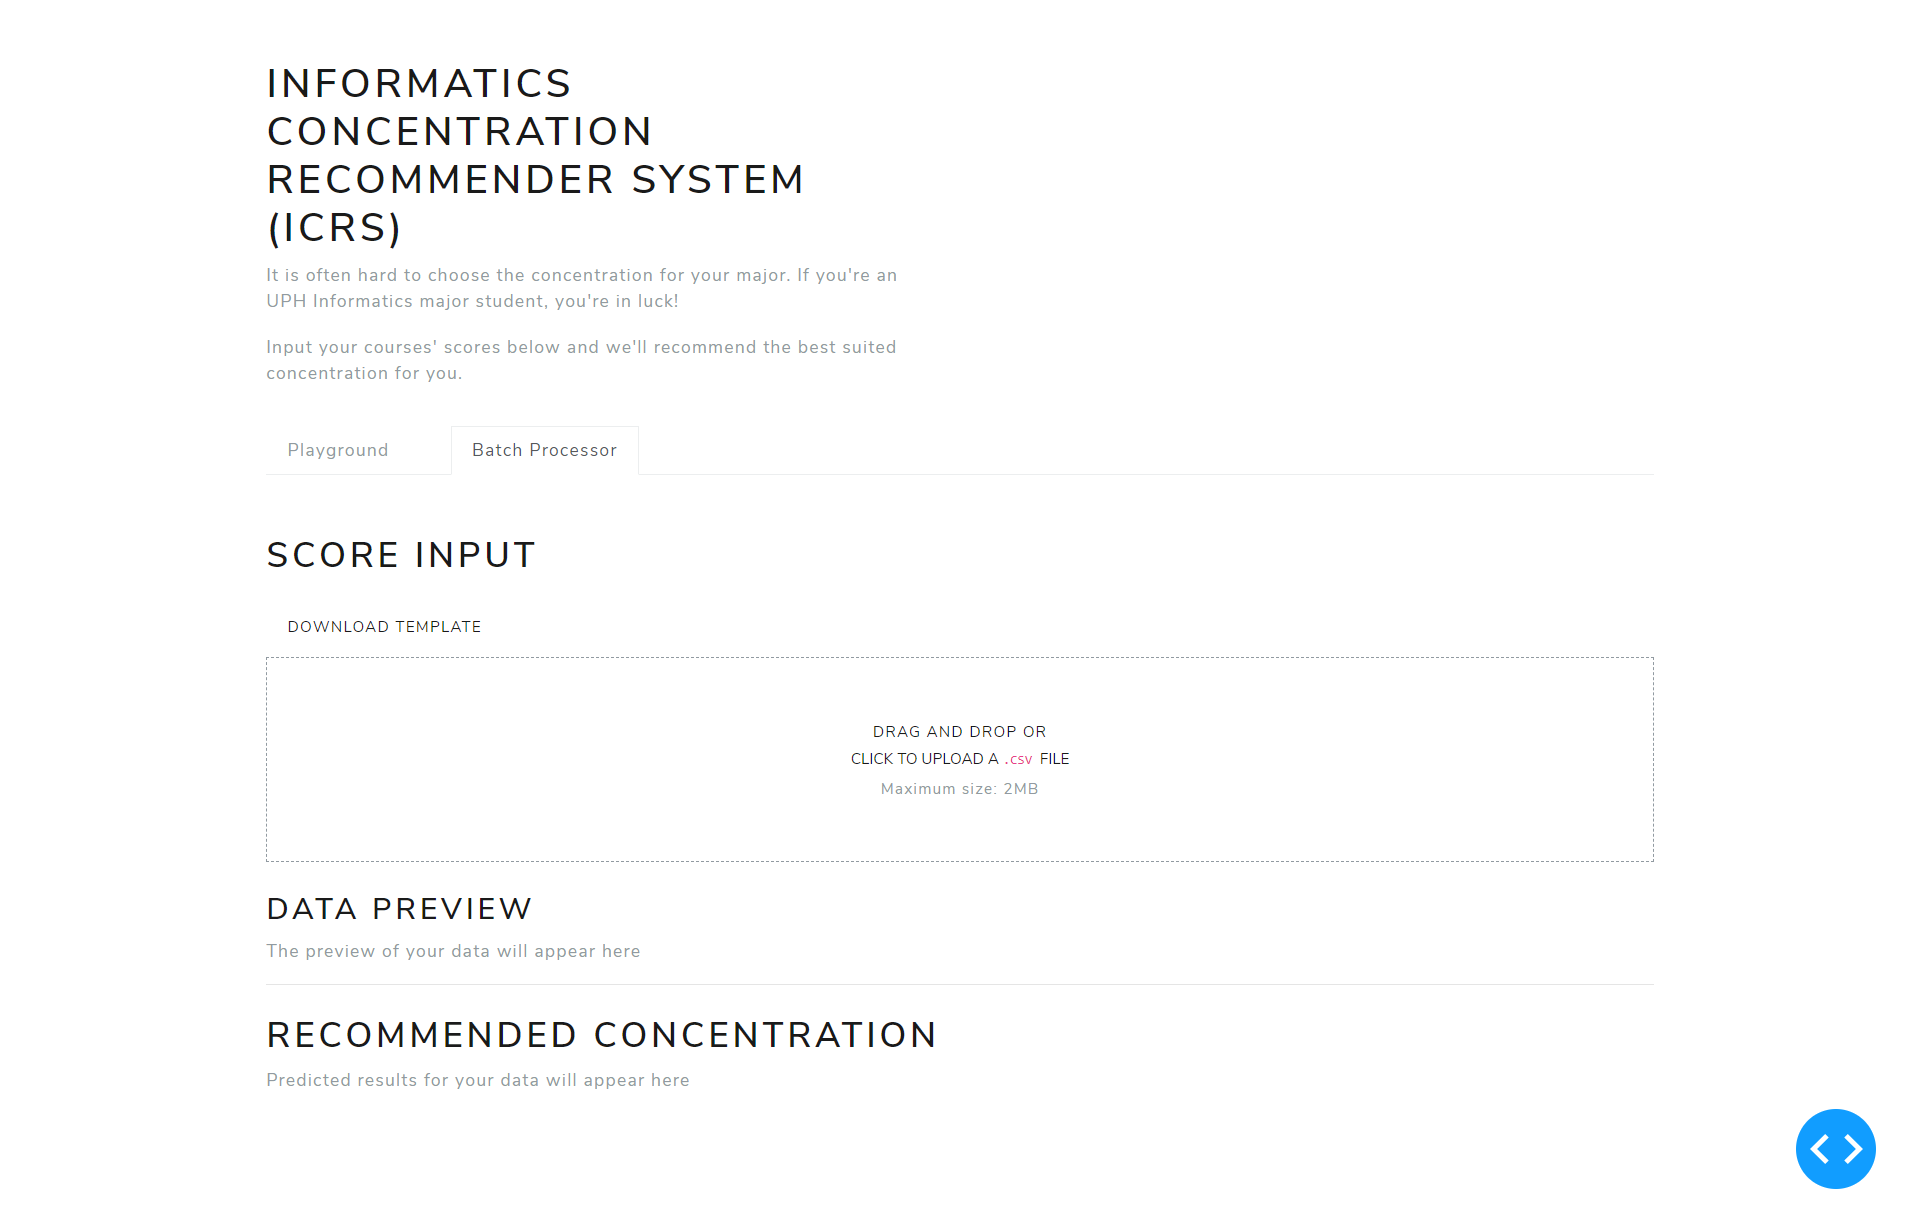
Another feature is available, which is to batch process a .csv file. When clicking the "Batch Processor" tab on top, you will be greeted with a screen like this:
You can download the template for the allowed csv format on the "Download template" button:
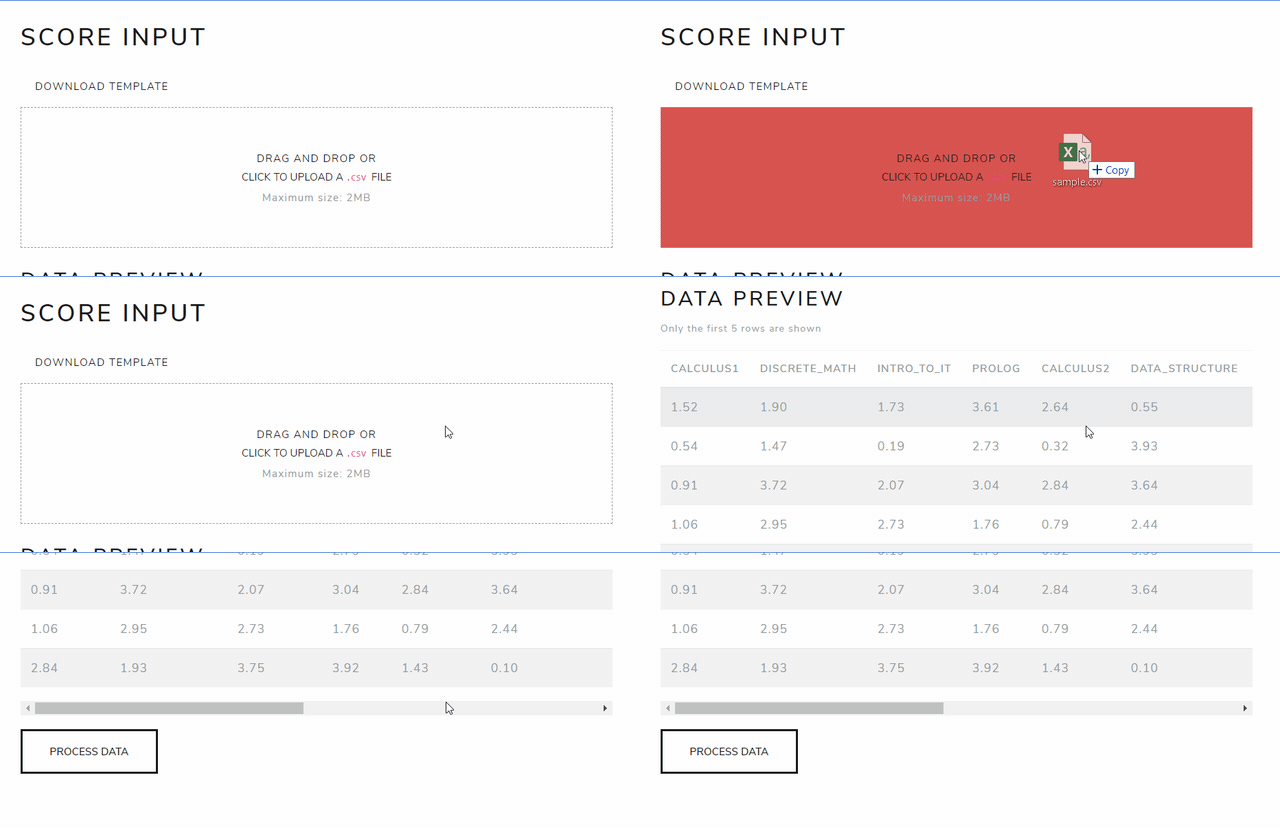
Once the csv file is ready, you can upload the file to the provided area:
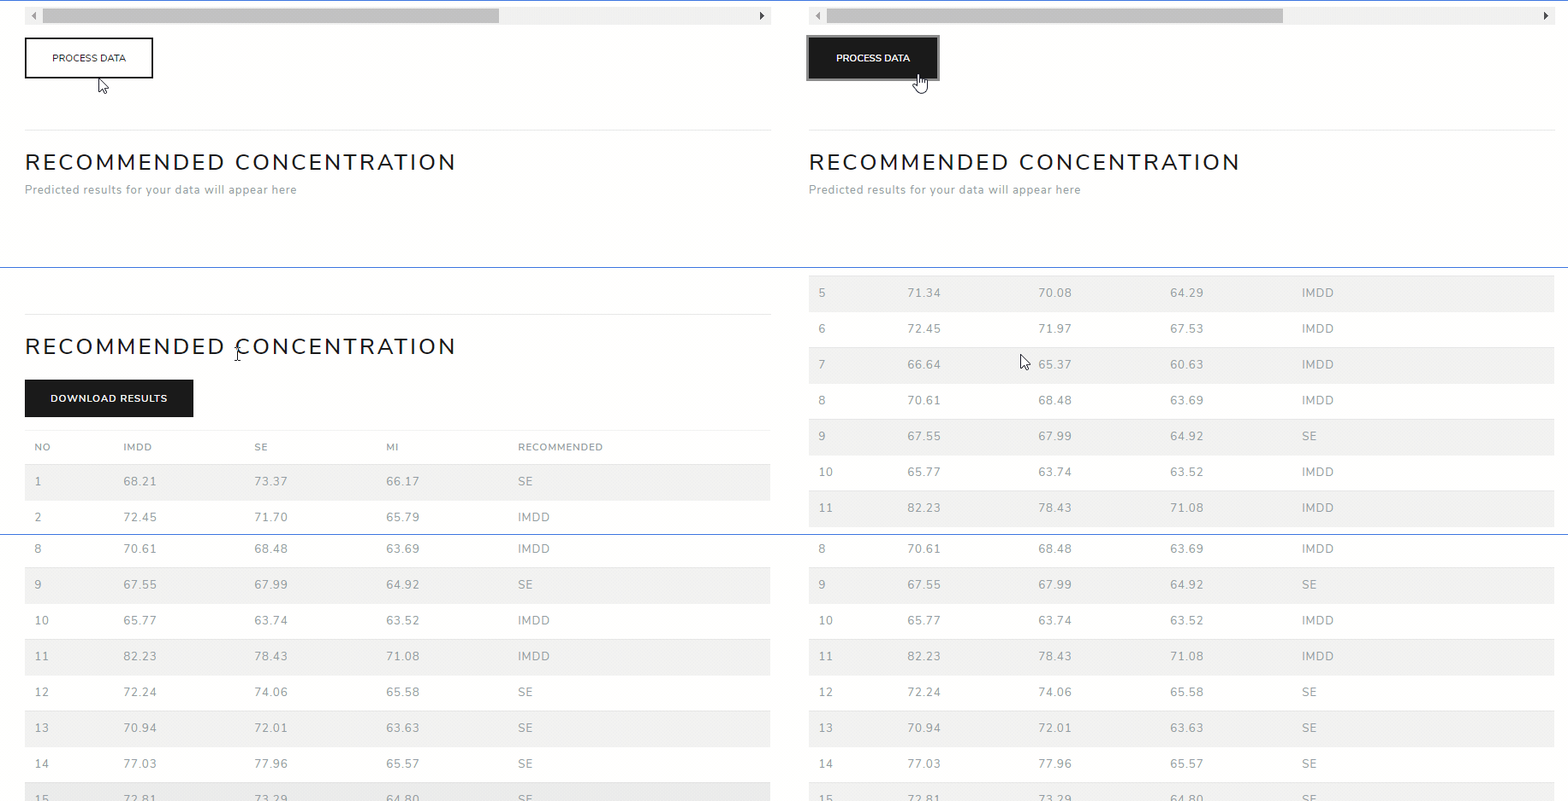
You can view the first 5 rows of the data. By clicking the "Process data" button, the file will be processed and outputted below:
As you may see, a "Download results" button is provided to download the results as a .csv file.
The diagram above shows several major steps in the whole development process, each of which is going to be explained in the following subsections.
With permission from UPH, the data were gathered from their database for all students, including alumnis from previous years. The gathered Informatics students' data were from cohorts 2012 until 2015. Along with them, past curriculum structures were also given.
The raw data needed to be transformed so that the prediction model can be trained. The process can be roughly summarized in the diagram below. If you want to understand its further details, you can read them here.
The prediction model is trained using a variant of Support Vector Machine (SVM) called Support Vector Regression (SVR). Its parameters are tuned using GridSearch. Full explanation can be seen here
The entry point of the web application is on main.py. Other components live inside the app directory, containing four main python files:
callbacks.py: Dash callbacks to register, so that data can flow between componentscomponents.py: UI componentsroutes.py: Flask routeslayout.py: Contains the main layout for the whole app
If you want to understand the app's code in detail, you might wanna look here or read the code yourself.
The previously trained model can be saved into a file using pickle, a built-in library for data serialization and deserialization. All of these files can be seen inside the model directory—the ones with the .sav extension. They are then loaded into predictor.py, which contains a class called Predictor that handles prediction requests. Below is a code snippet explaining the general gist of it.
# This code snippet is a rough implementation of how the
# model is first loaded and used for prediction
def predict(data):
  model_file = open('model.sav', 'rb')
  model = pickle.load(model_file)
return model.predict(data)Once everything is done, the app is ready to use. Example outputs and visualizations can be seen in the previous chapter
- Laurentius Dominick Logan - nickylogan
- Nadya Felim Bachtiar - Ao-Re
- Barjuan Davis Penthalion - cokpsz
Made as a Data Science course project in Universitas Pelita Harapan
