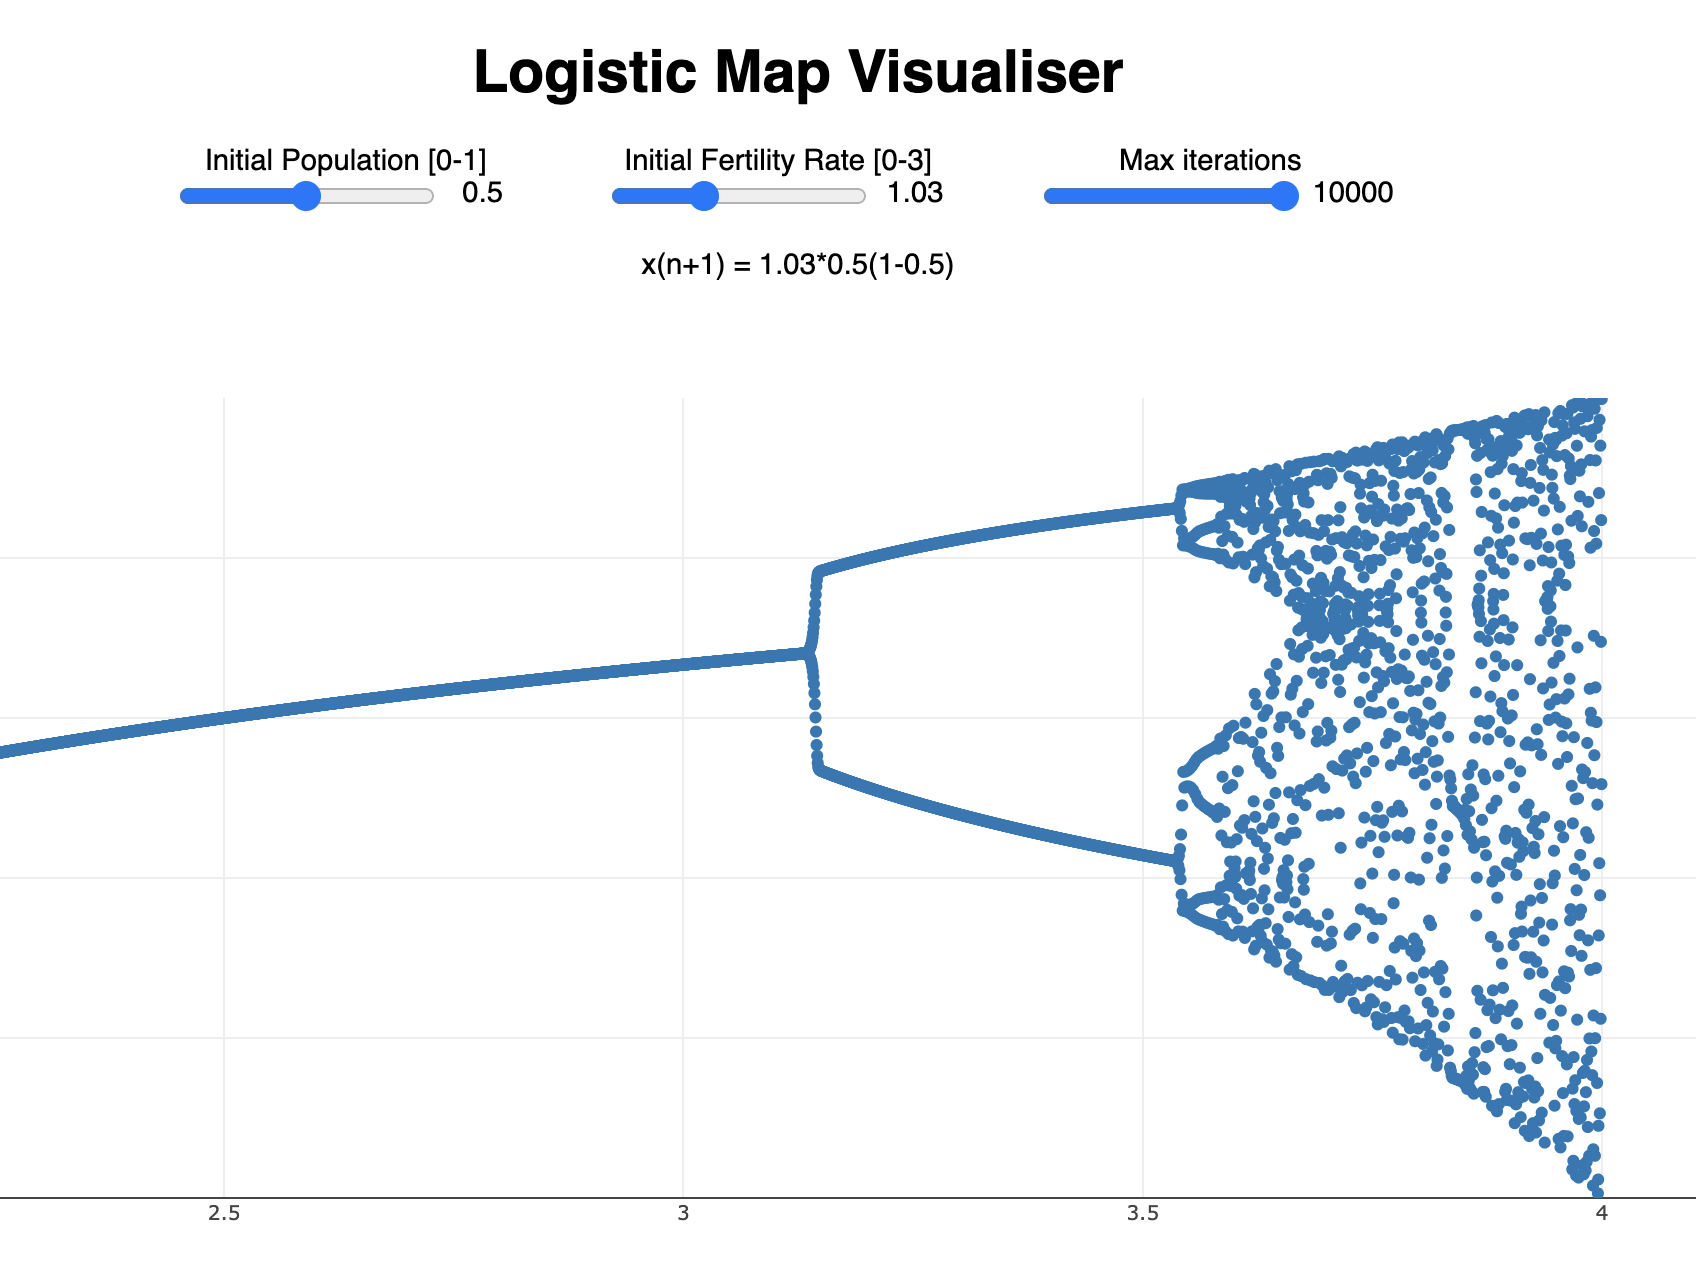
This project uses Plotly to plot the visualisation of the Logistic Map, originally introduced by Robert May. From a growth of approximately 3.56995 onwards, it starts behaving chaotically for the most part (with some ordered--read periodic--parts from time to time). This equation and its chaotic behaviour was one of the first methods used to create pseudo-random numbers in computers.


