python scripts to visulaize the data from can and calculate the width of detected lanes
The code was tested in Nvidia Jetson AGX xavier with dedicated can port.
the program requires flask and can drivers.
If your board does not have Flask, run
pip install FlaskFor enabling CAN on AGX xavier follow the instrcutions from this repo
https://github.com/Aravindseenu/CAN-communication-on-Nvidia-AGX-xavierFor other devices initialise the can port as shown:
  ip link set can0 type can bitrate 500000 triple-sampling on
ifconfig can0 upClone this respository and move into it with
  git clone https://github.com/Aravindseenu/mobileye-data-visualization
  cd mobileye-data-visualization
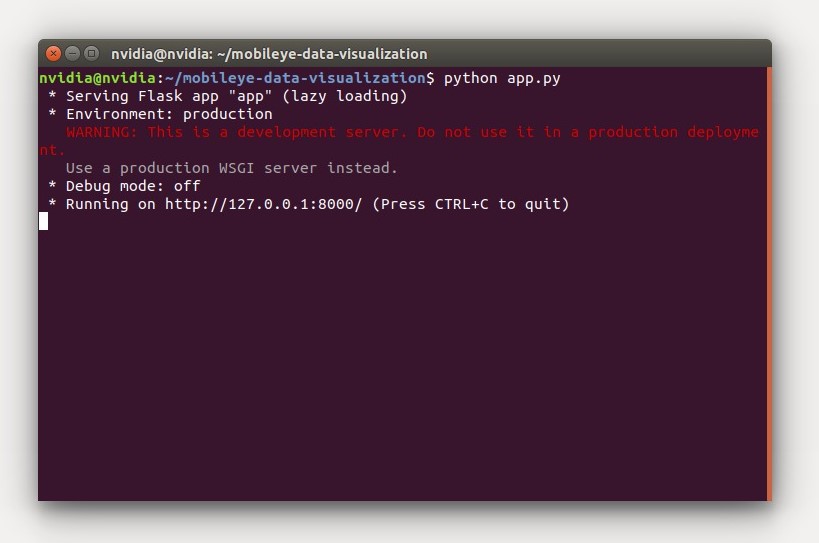
and run the server with
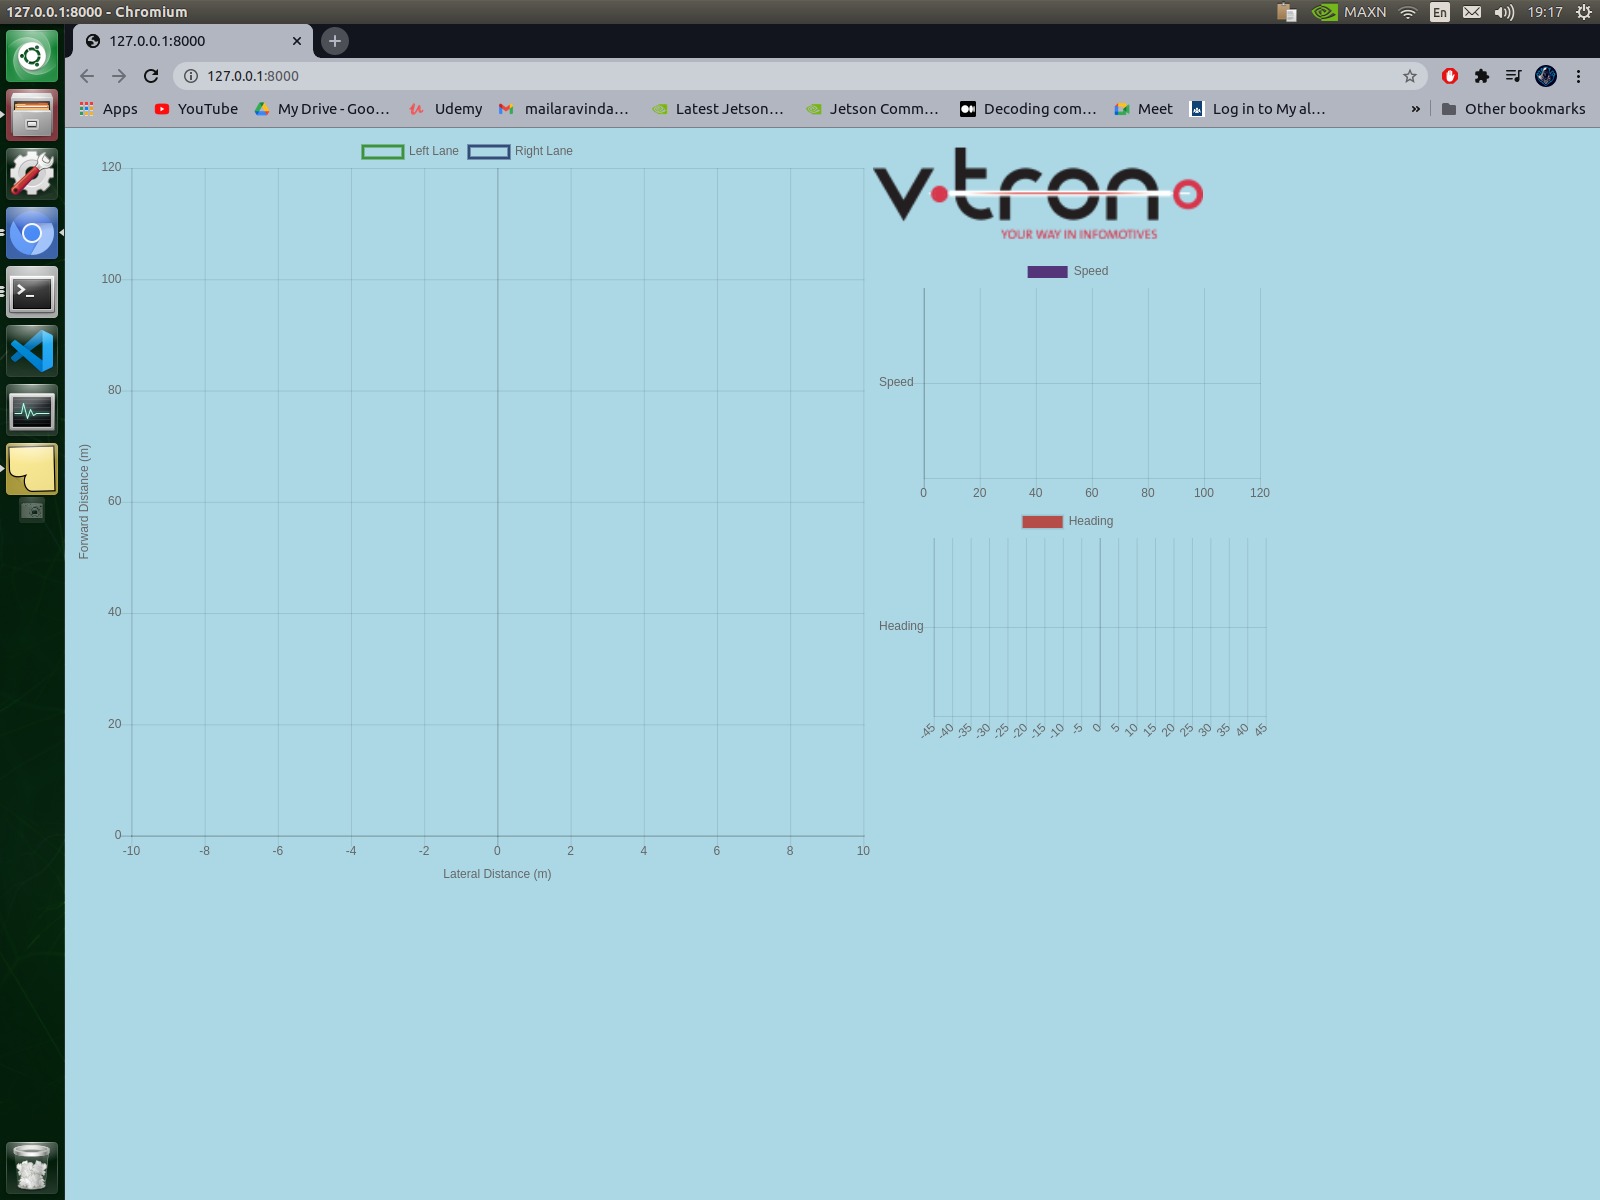
python app.py when the web link is clicked the following page will appear
 Note: the graphs will be generated only when data is recived from the mobileye configured in a vechile
Sample can data is provided to check the working of app
  cd can_message
  python can.py
For lane width calculation execute mobileye_width.py in seperate terminal
python mobileye_width.pyto have the camera view ,additional camera is required instead of app.py execute app_cam.py
python app_cam.pynote: the web page ip and ports can be altered
![[output]](https://raw.githubusercontent.com/Aravindseenu/mobileye-data-visualization/main/./images/output.jpeg)
![[camera]](https://raw.githubusercontent.com/Aravindseenu/mobileye-data-visualization/main/./images/camera.png)