Displays performance information in a Godot project during gameplay. Can be used when running from the editor and in exported projects. Inspired by id Tech 6/7's performance overlay.
This repository only contains the add-on. See godot-extended-libraries/godot-debug-menu-demo for the demonstration project.
- Features compact and full display modes, with the compact mode only displaying FPS, frametime and framerate cap.
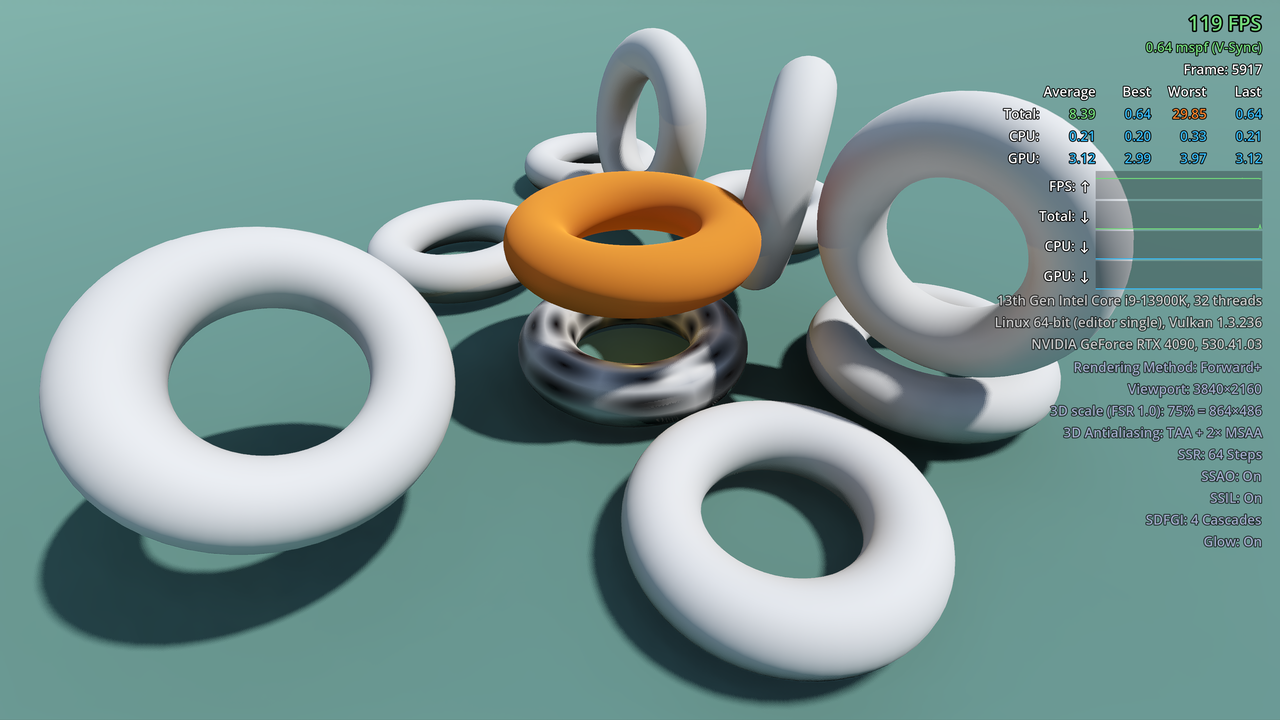
- Displays FPS, frametime, CPU time and GPU time graphs with a summary of the best/worst/average frametimes over recently drawn frames.
- Displays hardware information, including graphics driver version.
- Displays software information, including project version (if specified in the
application/config/versioncustom project setting) and graphics settings. - Works with the Forward+, Mobile and Compatibility rendering methods.
- Works with 2D and 3D projects.
- Works when running the project from the editor, but also in exported projects (debug and release).
- Compared to the Godot editor's Profiler, Monitors and Visual Profiler bottom
panels, you can look at an in-game debug menu while the project is running,
even in fullscreen if you only have a single monitor.
- Rendering performance is highly dependent on window size, so resizing the window is not advised for reliable performance measurements in real world scenarios.
- This debug menu accurately displays graphs and best/worst frametime metrics over a period of the last 150 rendered frames, which is useful to diagnose stuttering issues. The Monitor bottom panel is only updated once a second and doesn't feature a 1% low FPS metric, which makes tracking stuttering difficult when relying solely on the monitors.
- This debug menu can be used in exported projects to reliably test performance without any editor interference. This includes testing on mobile and Web platforms, which tend to be more difficult to set up for profiling within Godot (if it's even possible).
- This debug menu can be used in exported projects for tech support purposes. For example, in a bug report, you could ask a player to upload screenshots with the debug menu visible to troubleshoot performance issues.
External tools such as RTSS or MangoHud provide some insight on how well a project actually runs. However, they lack information on engine-specific things such as per-frame CPU/GPU time and graphics settings.
- Open the Godot editor.
- Navigate to the AssetLib tab at the top of the editor and search for "debug menu".
- Install the Debug Menu plugin. Keep all files checked during installation.
- In the editor, open Project > Project Settings, go to Plugins and enable the Debug Menu plugin.
Manual installation lets you use pre-release versions of this add-on by
following its master branch.
- Clone this Git repository:
git clone https://github.com/godot-extended-libraries/godot-debug-menu.gitAlternatively, you can download a ZIP archive if you do not have Git installed.
- Move the
addons/folder to your project folder. - In the editor, open Project > Project Settings, go to Plugins and enable the Debug Menu plugin.
- Press F3 while the project is running. This cycles between no debug menu, a compact debug menu (only FPS and frametime visible) and a full debug menu.
The key to cycle the debug menu is currently hardcoded. You can change it in
addons/debug_menu/debug_menu.gd's _input() method.
Copyright © 2023-present Hugo Locurcio and contributors
Unless otherwise specified, files in this repository are licensed under the MIT license. See LICENSE.md for more information.