Data Analysis with Matplotlib
The overall purpose of this project was to provide visual analysis of the performance of a rideshare company (PyBer), and it's drivers, across three different city types - urban, suburban, and rural. The starting data consisted of two separate CSVs, sampled from the first half of 2019, which when combined, contained the following information:
- the name of the city in which the ride took place,
- date & time of the ride,
- the ride fare,
- a unique ride ID number,
- the number of drivers in that given city,
- how that city was classified (urban, suburban, or rural).
Early analysis of the data focused on painting an overall picture of the service's performance, comparing and contrasting such factors as fares, number of rides, and driver counts against city types, via the use of bubble charts, bar-and-whisker plots, and pie charts. The final analysis was a summary over time for the weekly fares, grouped by city type.
The charts and graphs illustrate a significant difference in rideshare activity across the three different city types.
(Note: the chart titles and axis labels may not be visible in Github's Dark Mode)

This initial summary bubble chart displays the average fare of rides in a given city, charted against the total number of rides in that city. The size of the circles correlates to the number of drivers in that city, and the color of the bubbles correlates to the city type designation, as noted in the legend. What we can see right off the bat is that:
- there is much more rideshare activity, and more drivers, in urban cities compared to rural cities (and with suburban cities falling somewhere in between);
- the average fares in rural cities cover a much broader range, but trend towards being more expensive, while average fares in urban cities are less expensive.
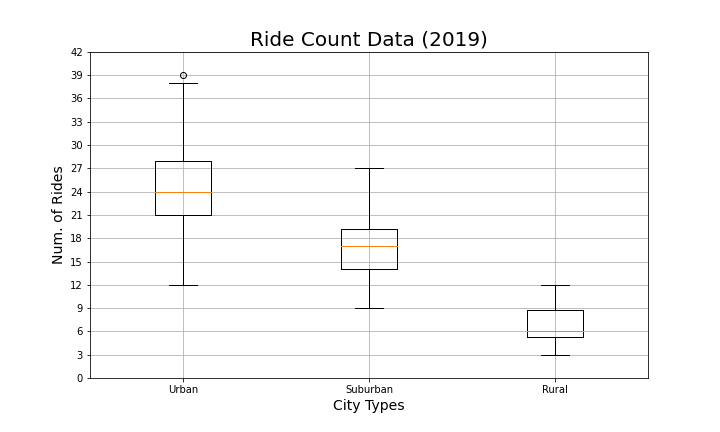

The ride count bar-and-whisker chart displays the range of number of rides in each city, by city type. This echos our previous chart, showing that there is much more rideshare activity in urban cities, slightly less in suburban cities, and much less in rural cities. Low ride counts in rural locations could be due to poor market development, but it could also be due to the fact that people living in rural locations all tend to have their own vehicles.

The ride fare bar-and-whisker chart displays the range of fares per ride within cities in each city type. This chart further describes how ride fares in urban locations tend to be lower and fares in rural locations tend to be higher. This is likely due to the fact that rides taken within urban environments would tended to be shorter trips, while rural rides would tend towards being longer, covering greater distances.

The driver count bar-and-whisker chart displays the range of number of drivers within cities in each city type. This shows how, in urban locations, there tend to be lots of drivers, while there tend to be far fewer drivers in rural locations, and again suburban locations fall somewhere in the middle. It stands to reason that market demand would drive (no pun intended) how many drivers would participate in a rideshare service. High driver numbers are unlikely to be anywhere but in high-demand markets.

The fares percentage pie chart displays the fare intake by city type, as percentages of the total. To no one's surprise, with a surplus of the rides and the lionshare of drivers, urban markets make up the majority percentage of all fares taken in by the company (62.7%). Even though fares were higher on a per-ride basis in rural locations, due to the low number of rides in those locations, rural rides only accounted for 6.8% of the fare total.

The rides percentage pie chart displays the number of rides given by city type, as percentages of the total. Here the trend continues, with urban markets being the most active, suburban markets accounting for a little over a quarter, and rural markets consisting of just over 5% of all rides taken.

The drivers percentage pie chart displays the number of drivers by city type, as percentages of the total. And again we see that the drivers go where the rides (and total fares) are. Over 80% of all drivers partnered with the PyBer platform are driving in urban cities. Only just over 2.5% of drivers work in rural locations.
While all of these charts are wonderful and enlightening, they all fail to incorporate an important factor in their analysis of the data presented -- time. In the final summary analysis for this project we were asked to produce a chart that looked at fare data over the first four months of 2019.

In this fare summary line chart we can see weekly fare intake, grouped by city type. Here we see more of the same, without any real surprises. Weekly fare intake numbers are steadily highest in urban locations, lowest in rural locations, and follow a midrange in suburban locations.
Based on this evidence I would make the following three suggestions for projects to potentially expand PyBer's ridesharing platform:
- Focus some additional market development efforts in rural communities. Recruit more drivers; increase ad-spend in those regions; drop per-mile rates for rural cities. There's a lot of growth to be had there. While it may come slow and be hard fought, PyBer might find some heavily under-served communities out beyond the suburbs.
- Experiment with increasing per-mile fare rates in urban and suburban locations. Urban locations currently have the most rides, and small increases in fares there could really boost our bottom line.
- Implement some weekly or special event pricing deals. The final chart demonstrates that fare intake is pretty steady, even on holidays. With some ads and deals, Pyber might increase ridership on particular days.