The OW data case challenge is a competition consisting in solving a business case study
by applying analytical skills to a set of real data;
(in this case data from the city of Paris).
We therefore looked at the question of the pricing of parking spaces in the city of Paris.
Our team was composed of :
- Paul Garnier (Mines de Paris, PSL University)
- Marc-Adrien Gergaud (ESCP Europe - Mines de Paris, PSL University)
- Théophane Gregoir (Mines de Paris, PSL University - MIT)
- Arthur Verrez (Mines de Paris, PSL University)
- A few graph on the Paris Open Data : arrondissements, in the form of a GeoJson. This file is used with folium to create maps.
- For example, the dependancy between the time spent by users, depending on the districts and the arrival time :

- The .npy files are not available in this repo.
- A few scripts in .py to create folium maps. They are however only compatible with our .npy files.
- A few examples of folium maps in .html. To use/display them, copy the source code and save it in an html file.
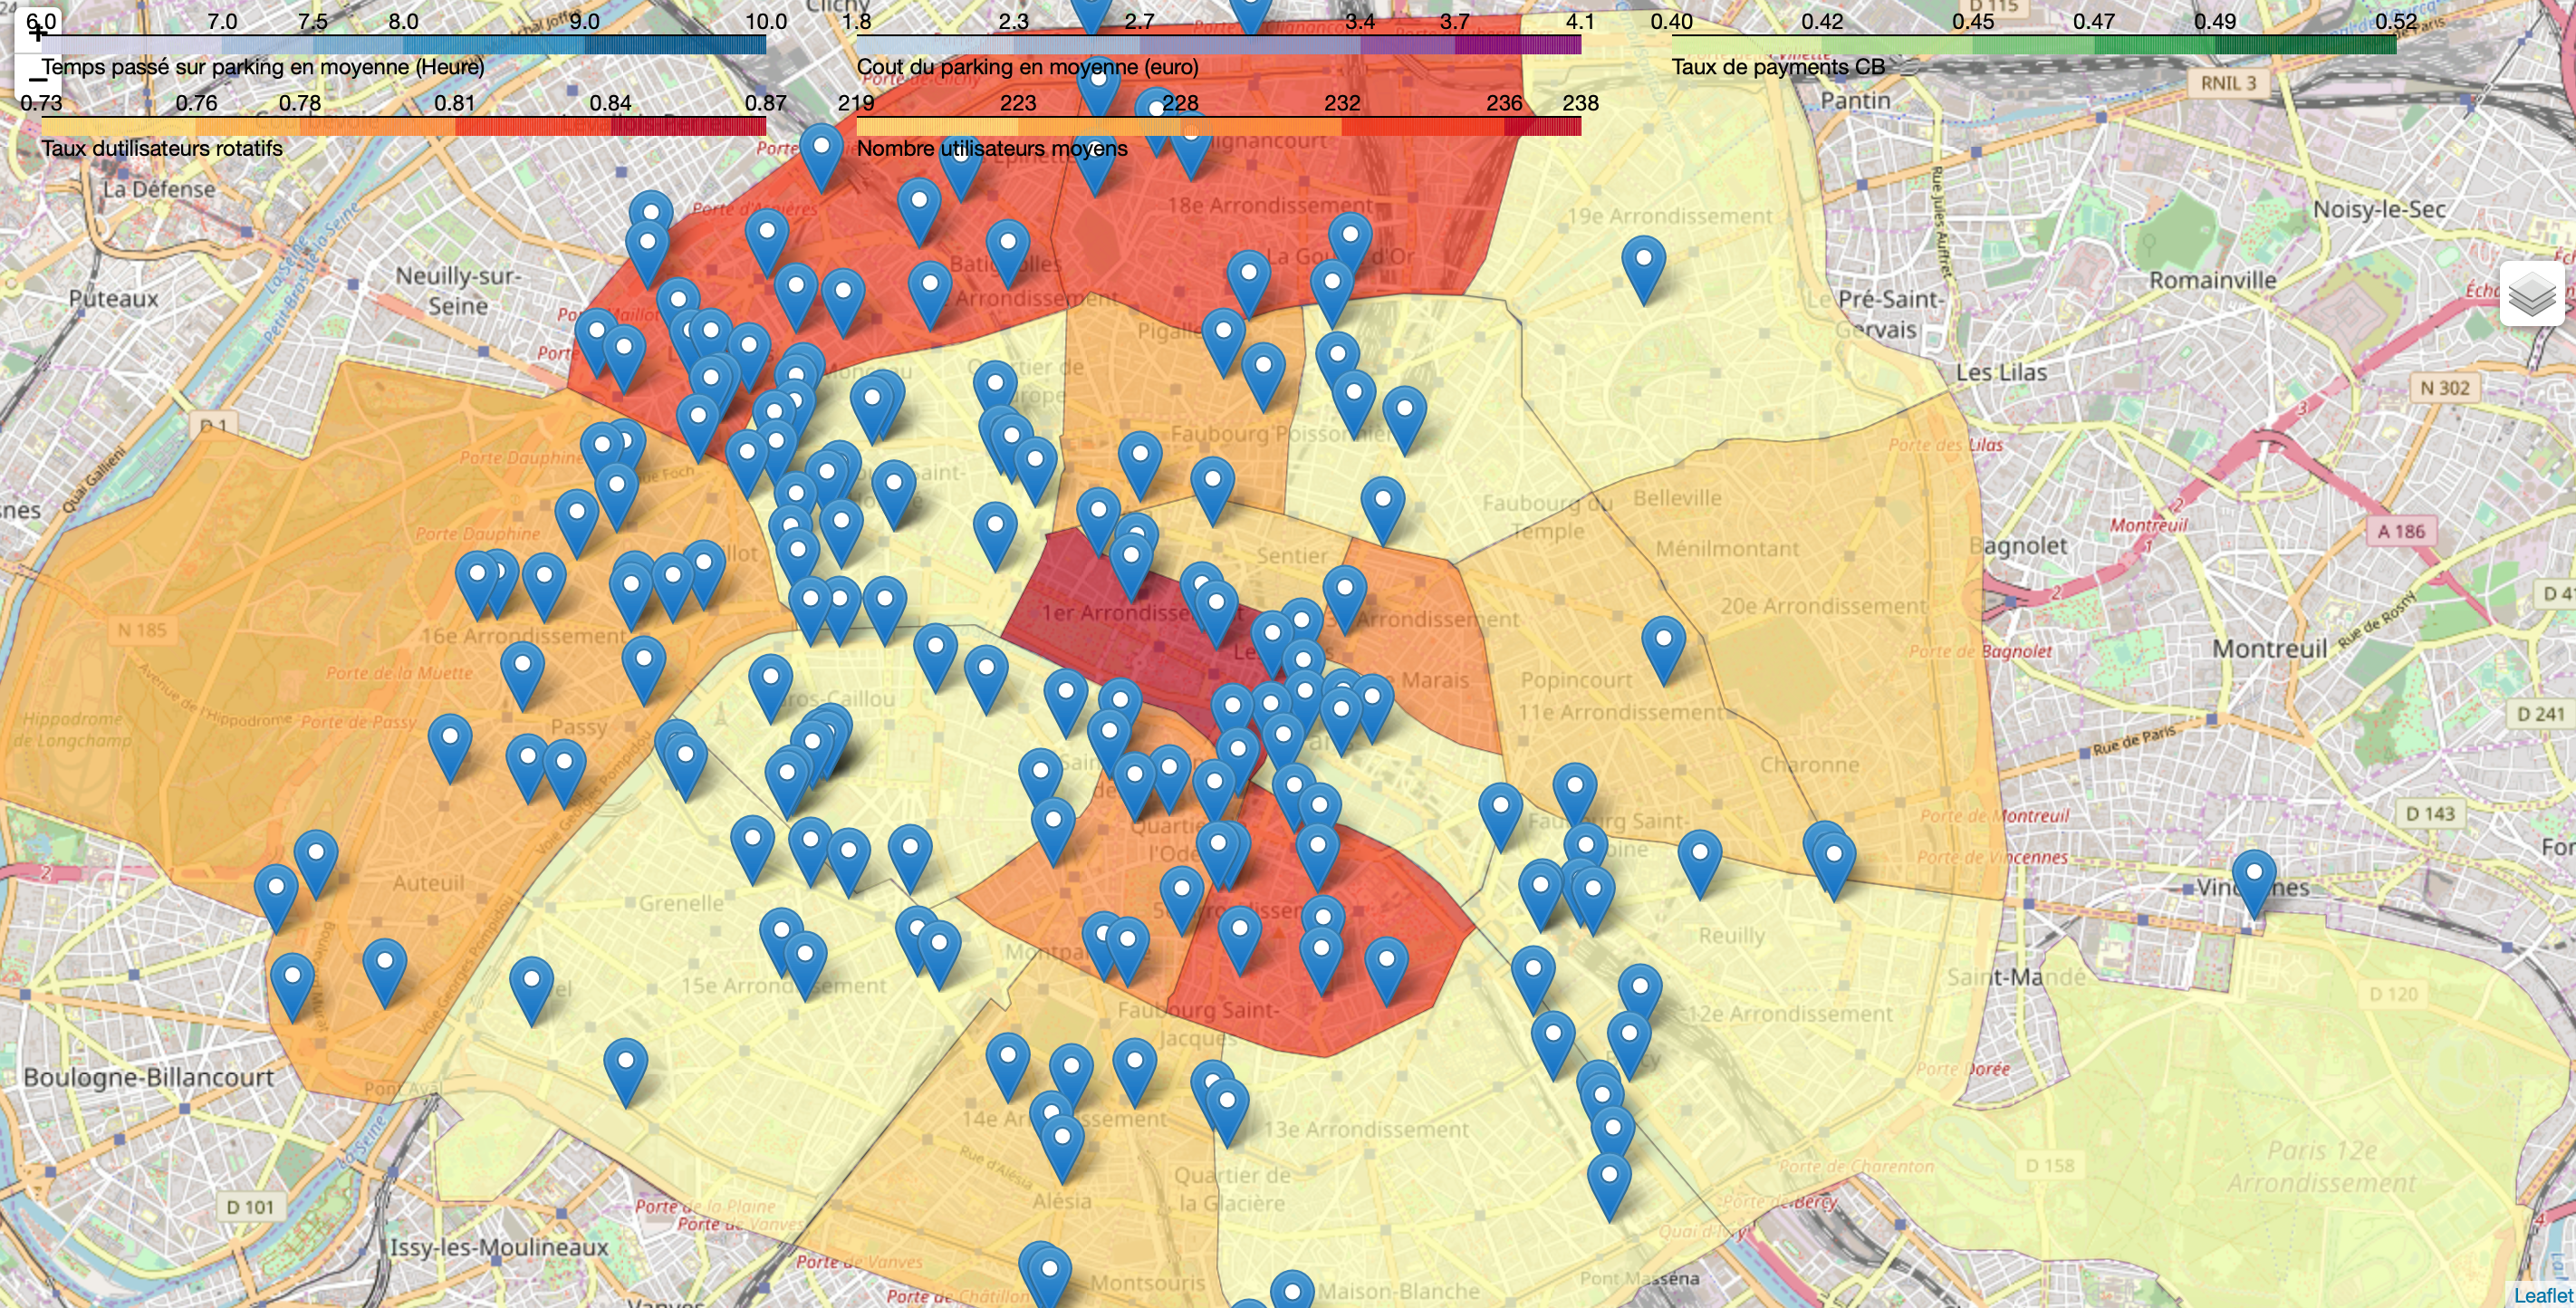
- For example, with map arrondissement, you will be able to display a map presenting different characteristics by district (time spent, attendance, average cost, rate of rotating users and rate of blue card), as well as underground car parks in Paris (in blue).

- {Data,Map,Graph}Maker: the .py files used to create the majority of our maps, graphs, and tables used in our calculations.
- AI: Algorithms allowing the simulations of our environments (GA,NN,RP) and revenue calculations.
- Example of the result of the GA (20 generations only, for the example) :
