In this project as an entry-level data analyst at the fictional Mint Classics Company, I am tasked with analyzing data in a relational database with the goal of supporting inventory-related business decisions that lead to the closure of a storage facility.
Mint Classics Company, a retailer of classic model cars and other vehicles, is considering closing one of its storage facilities.
To support a data-based business decision, they are looking for suggestions and recommendations for reorganizing or reducing inventory while maintaining timely service to their customers. For example, they would like to be able to ship a product to a customer within 24 hours of the order being placed.
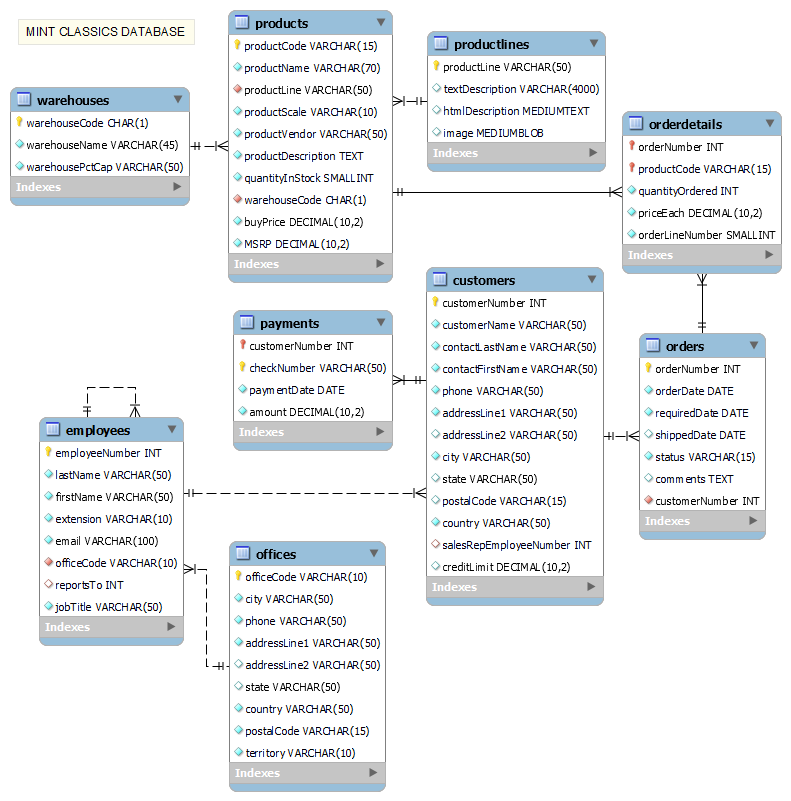
As a data analyst, I have been asked to use MySQL Workbench to familiarize myself with the general business by examining the current data. I received a data model and sample data tables to review. I will then need to isolate and identify those parts of the data that could be useful in deciding how to reduce inventory.
-
Explore products currently in inventory.
-
Determine important factors that may influence inventory reorganization/reduction.
-
Provide analytic insights and data-driven recommendations.
My challenge will be to conduct an exploratory data analysis to investigate any patterns or themes that may influence the reduction or reorganization of inventory in the Mint Classics storage facilities. To do this, I will import the database and then analyze the data. I will also pose questions, and seek to answer them meaningfully using SQL queries to retrieve data from the database provided.
Database SQL creation script provided and can be seen here.
1. Where are products stored?
The South warehouse appears to be the best candidate for closing.
- Least amount of total inventory(79,380)
- Smallest capacity available(75% full)
- Least total storage capacity(105,840)
- Filled the least number of orders(22,351)
- Only accounts for 20% of total sales.
There is more than enough space at the West
warehouse, which is running at half capacity, with room for @120k items. The
North and East warehouses have 28% and 33%, respectively, available space as well.
SQL Query
WITH wareprod_tbl  AS
(SELECT
    w.warehouseCode,
    w.warehouseName,
    w.warehousePctCap,
    p.itemsInStock,
    p.productCnt,
    p.productLineCnt
FROM
    warehouses w
        INNER JOIN
    (SELECT
        warehouseCode,
        SUM(quantityinStock) AS itemsInStock,
        COUNT(productCode) AS productCnt,
        COUNT(DISTINCT productLine) AS productLineCnt
    FROM
        products
    GROUP BY warehouseCode) AS p ON p.warehouseCode = w.warehouseCode
ORDER BY p.itemsInStock),
wrkord_tbl AS
(SELECT
    warehouseCode,
    warehouseName,
    warehousePctCap,
    SUM(quantityOrdered) AS itemsOrdered,
    SUM(lineTotal) AS totalSales
FROM
    (SELECT
        o.orderNumber,
            o.productCode,
            p.warehouseCode,
            w.warehouseName,
            w.warehousePctCap,
            o.quantityOrdered,
            o.priceEach,
            (o.quantityOrdered * o.priceEach) AS lineTotal
    FROM
        orderdetails o
    LEFT JOIN products p ON o.productCode = p.productCode
    LEFT JOIN warehouses w ON p.warehouseCode = w.warehouseCode) AS wrk_table
GROUP BY warehouseCode, warehouseName, warehousePctCap)
SELECT
    wp.warehouseName,
    wp.warehousePctCap,
    ROUND((wp.itemsInStock / (wp.warehousePctCap / 100)), 0) AS warehouseCap,
    (ROUND((wp.itemsInStock / (wp.warehousePctCap / 100)), 0) - wp.itemsInStock) AS freeSpace,
    wp.itemsInStock,
    wo.itemsOrdered,
    wo.totalSales,
    ROUND((wo.totalSales / 9604190.61), 2) AS pctTotalSales
FROM wareprod_tbl wp
        LEFT JOIN
	 wrkord_tbl wo ON wp.warehouseCode = wo.warehouseCode
ORDER BY wo.totalSales DESC;
Results
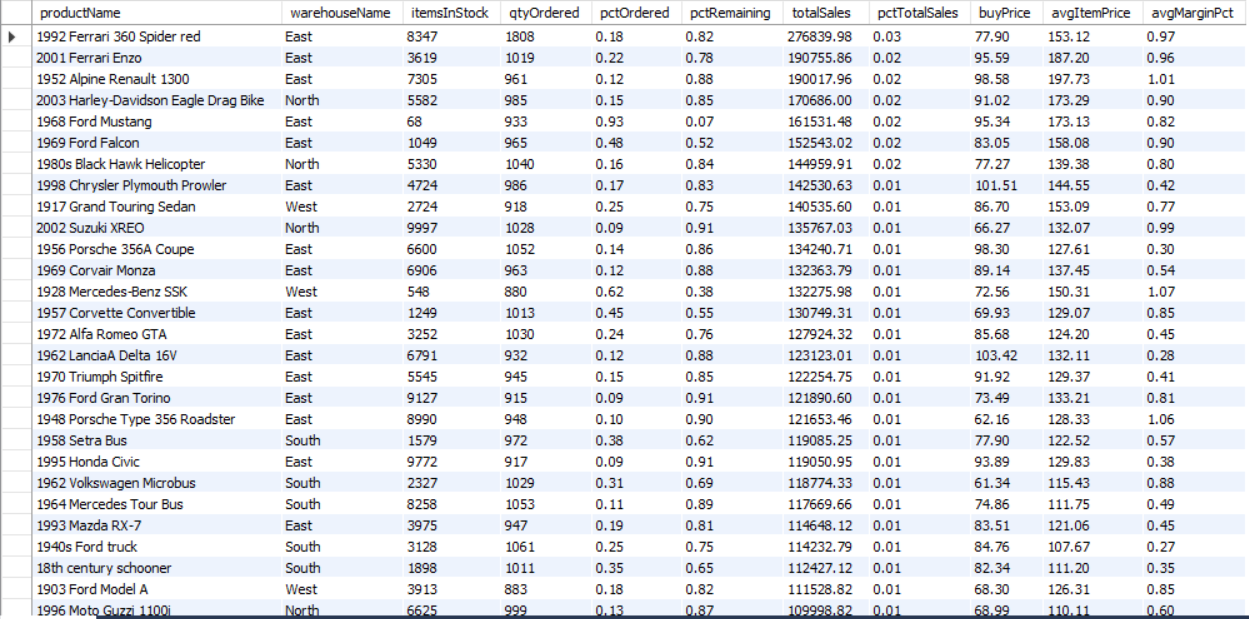
2. Do the inventory counts seem appropriate for each item?
There are signs that current inventory management processes should be improved upon.
Ex. Adjusting par levels for products and discontinuing products that do not sell.
- 4 products with 15% or less of their stock remaining
- 10 products with 45% or less of their stock remaining
- 17 products have had 10% or less of their stock ordered
Looking at the top 10 products by sales:
- 1 product has only 7% of stock remaining
- 1 product has 52% of stock remaining
- 8 products have 75% or more of their stock remaining
Looking at the top 10 products by quantity ordered:
- 1 product has 69% of its stock remaining
- 1 product has 75% of its stock remaining
- 8 products have 82% or more of their stock remaining
SQL Query
SELECT
    pw.productName,
    pw.warehouseName,
    pw.itemsInStock,
    o.qtyOrdered,
    ROUND((o.qtyOrdered / (pw.itemsInStock + o.qtyOrdered)), 2) AS pctOrdered,
    (1 - ROUND((o.qtyOrdered / (pw.itemsInStock + o.qtyOrdered)), 2)) AS pctRemaining,
    o.totalSales,
    ROUND((o.totalSales / 9604190.61), 2) AS pctTotalSales,
    pw.buyPrice,
    ROUND((o.totalSales / o.qtyOrdered), 2) AS avgItemPrice,
    ROUND((((o.totalSales / o.qtyOrdered) / pw.buyPrice) - 1), 2) AS avgMarginPct
FROM
    (SELECT
        p.productCode,
            p.productName,
            p.warehouseCode,
            w.warehouseName,
            SUM(p.quantityInStock) AS itemsInStock,
            p.buyPrice
    FROM
        products p
    LEFT JOIN warehouses w ON p.warehouseCode = w.warehouseCode
    GROUP BY p.warehouseCode, p.productCode, p.productName, w.warehouseName, p.buyPrice) pw
        LEFT JOIN
    (SELECT
        productCode,
            SUM(quantityOrdered) AS qtyOrdered,
            SUM((quantityOrdered * priceEach)) AS totalSales
    FROM
        orderdetails
    GROUP BY productCode) o ON pw.productCode = o.productCode
-- WHERE warehouseName = 'South'
ORDER BY totalSales DESC, pctOrdered DESC;
-- LIMIT 10;
Results
3. How many customers are serviced by each warehouse?
The current warehousing process has various warehouses servicing the same customers. Closing the South warehouse would affect 81 customers. Properly redistributing our current inventory to the remaining warehouses would have a minimal impact on shipping times. The inventory par, minimum, and maximum stock levels should be implemented. There are several products with over 60% of their inventory remaining while some of our best sellers have less than 20% left in stock. The marketing and sales teams should be consulted to devise a course of action to trim current stock levels, as we phase out products, and procure more stock of the best-selling products.
SQL Query
SELECT
    warehouseName,
    totalCustomers,
    ROUND((totalCustomers / 98), 2) AS customerPct
FROM
    (SELECT
        warehouseName,
            COUNT(DISTINCT customerNumber) AS totalCustomers
    FROM
        (SELECT
        o.customerNumber, w.warehouseName
    FROM
        orders o
    LEFT JOIN orderdetails od ON o.orderNumber = od.orderNumber
    LEFT JOIN products p ON od.productCode = p.productCode
    LEFT JOIN warehouses w ON p.warehouseCode = w.warehouseCode) cust_ware
    GROUP BY warehouseName
    ORDER BY totalCustomers DESC) agg_tbl;
Results
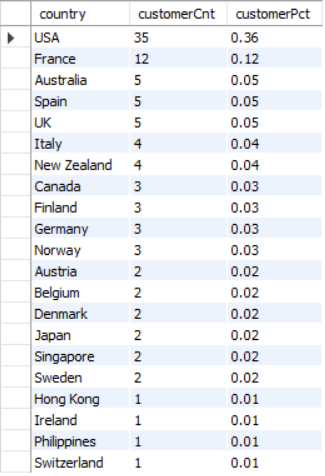
Lastly, I want to look at where, country-wise, our customers are located. This data will be helpful in discovering how to best redistribute our products. Merging the orders and 'customers' table with an inner join is the route I'll take. I only want to look at customers who have placed an order. For each country, I want to know how many customers are located there and what is that percentage-wise.
Less than 9% of our customers should be affected by closing the South warehouse. Locating which products are more popular by location and ensuring there is a regular supply at the 2 closest warehouses should keep shipping times close to current levels if not improve them by having an efficient logistics process.
SQL Query
SELECT
    c.country,
    COUNT(DISTINCT o.customerNumber) AS customerCnt,
    ROUND((COUNT(DISTINCT o.customerNumber) / 98),
            2) AS customerPct
FROM
    orders o
        INNER JOIN
    customers c ON c.customerNumber = o.customerNumber
GROUP BY c.country
ORDER BY customerCnt DESC;
Results
1. Closure of the South warehouse
The South warehouse is the best candidate for closure. With its lower inventory capacity and location of customers, products can be reassigned
to the remaining warehouses based on the previous customer orders. Delivery times will be minimally affected.
2. Create an Inventory Management System
An Inventory Management Process should be implemented based on current inventory levels and the amount of units sold for each product. There are
numerous products that we do not have the sales figures to support the amount kept in inventory. Several of the best-selling items have less than
20% stock remaining. Adjusting the maximum inventory levels necessary for each product should allow for the space needed to redistribute
products to maintain current shipping standards. Adjusting the minimum inventory levels, ie. reorder threshold of 30%, allows for proper restocking
of items as dictated by sales.
3. Collaborate with Marketing, Sales, and Procurement Teams
The marketing and sales teams should be consulted to devise a course of action to trim current stock levels. More warehouse space will be available
for products that sell while decreasing overhead and product hold times. Procuring more stock of products we sell the most based on proper inventory
par levels while not ordering and storing stock that isn't as popular.
Examples:
- Using profit margin percentages, run a promotion/sale to reduce/eliminate our excess inventory.
- Establish a customer rewards program based on the number of orders placed in the last year, the length of membership, or the total amount spent.
- Perform a deep analysis to include which model cars sell in locations to optimize inventory levels and delivery times.


