Tensorflow Implementation of the Tablenet research Paper.
Blog Link : https://ashishsalaskar1.medium.com/tablenet-end-to-end-table-detection-and-tabular-data-extraction-from-scanned-document-images-13c846e8f8f5
You can find a demo of the model here : https://youtu.be/wvREr71zPe4
The task here is of extracting tables from the image as a two-step process. First, we train a model which will try to detect the table regions i.e area of the image which contains a table. Once table regions are found, another model would then Recognize the structure of the table. We can split the process into two steps
- Table Detection (Detect Table region)
- Table Structure Segmentation ( Detect the rows and columns in the detected table)
In our model we try to integrate both these steps into a single end-to-end trainable Deep Learning model.
We will be using the following datasets:
- Marmot Dataset
- Extended Marmots Dataset. The Marmot dataset has around 2000 pages which were collected and the corresponding ground-truths were extracted utilizing a semi-automatic ground-truthing tool “Marmot”. The dataset is composed of Chinese and English pages at a proportion of about 1:1. The English pages were crawled from the Citeseer website. The dataset contains images as well as an XML document containing the coordinates of the annotated table regions for each image.
To extract the bounding boxes from the table mask in the Marmots dataset. First, we need to convert the hex numbers into integers first. Marmots dataset first defines a CropBox which represents the content area. The bounding boxes have attributes that are relative to this crop Box
- First, we extract the CropBox coordinates and then we scale the bounding box coordinates so as to fit the actual page coordinates.
- We then transform the bounding box formats and fetch the masks
- In the end, after generating the mask we create a data frame to save the paths of each image file so that we can access these files easily.
Before we start working on the model, we will first create a Tensorflow Pipeline using a Dataloader for our dataset. This would be more efficient when compared to loading each image individually and processing them while training. Here are the preprocessing we do
- Read the image, table, and column masks from the paths. Resize each one of them to 800x800 and then normalize the images.
- We can make use of TF data pipeline methods like prefetch and parallel_calls to make the process more efficient.
The model architecture consists of 3 main parts Backbone / Encoder: Here we will use a pre-trained VGG-19 model as the encoder. The fully connected layers in the VGG-19 model (layers after Pool 5) are replaced with two (1x1) Conv layers. These act as input which is distributed to the table and column branches.
- Table Prediction Branch: Predicts the table masks
- Column Prediction Branch: Predicts the Column masks
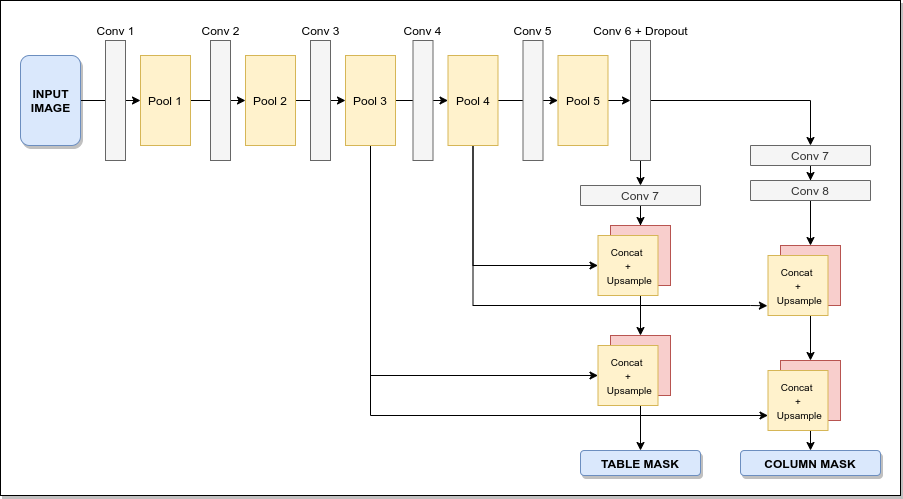
- Both column and table detection branches first have a 1x1 Conv layer followed by a series of fractionally slided convolution layers which are used to upscale the image to its original dimension. In the case of the column detection branch, we have an additional 1x1 Conv layer. The main purpose of using 1x1 Conv layers before upscaling is to reduce the dimensions.
- In each step, we will use skip-connections. The Pool3 and Pool4 layers will be combined with the layers in the two branches. These skip connections allow the model to take into consideration both high-level and low-level features which lead to better results
- In the end, both the table detection branch and column detection branch will output image masks that are of the same dimensions as that of the original image. We will then use the Training table and column masks to calculate the losses and train the model using backpropagation.
Once we get the predicted masks from the model, we try to use a few OpenCV functions to smoothen out the boxes. First, Gaussian blur is applied to the masks and then we try to find the contours in the mask. Once contours are found for each contour we fit a rectangular bounding rectangle which gives significantly better masks. Also, we ignore regions that are very small which indicate irregular points/patches. Using these post-processing steps the masks obtained are significantly better.
Once the table masks are predicted we use the PyTesseract library in order to extract the text from the Tables and save them into CSV files. We follow these steps First, take the input image and get the predicted masks from the model. Apply post-processing on these masks. Using these masks, get the regions of interest from the original image. We mask non-table regions with black color. Use OpenCV functions, in order to extract these individual tables. For each table apply some processing like sharpening filters, reshape and thresholding. Once each table is processed, save that table image separately. We then pass the Table region to extract the text from the table and save it into a CSV file. In the end, we would get images of individual tables as well as the CSV files for each table.
