Ansible/Docker project for operating Aura's servers
Please refer to How To Contribute
Create the group_vars/all/secrets.yml file with the following variables:
jupyter_client_id: <GitHub OAuth application Client ID for JupyterHub>
jupyter_client_secret: <GitHub OAuth application Client Secret for JupyterHub>
ansible-playbook -vv --diff -i inventories/prod.yml install.yml [-t time_series_db -t jupyter -t reverse_proxy]
- Ansible v2.4.2
- The server has to have a user
aurawith following/etc/sudoersconfiguration :aura ALL=(ALL) NOPASSWD: ALL
- Vagrant v1.8.6
- To have a public ssh key on your local machine on location :
~/.ssh/id_rsa.pub
- (only once) :
echo -e "192.168.33.22\tdb.aura.healthcare.local" | sudo tee -a /etc/hosts vagrant upansible-playbook -i inventories/dev.yml install.yml [-t time_series_db -t reverse_proxy, ...]- Enjoy
vagrant destroy
Your local vagrant environment is configured inside the inventory inventories/dev.yml.
You can run any playbook on this environment.
To have a local url that route to this development environment you can add this line in your hosts file (/etc/hosts) : 192.168.33.22 db.aura.healthcare.local
Once you have executed the vagrand up command and run the install.yml playbook on the development environment you can change the configuration of the mobile app to use the db.aura.healthcare.local url, you can do any test.
You can ssh to the virtual machine with ssh ansible@192.168.33.22
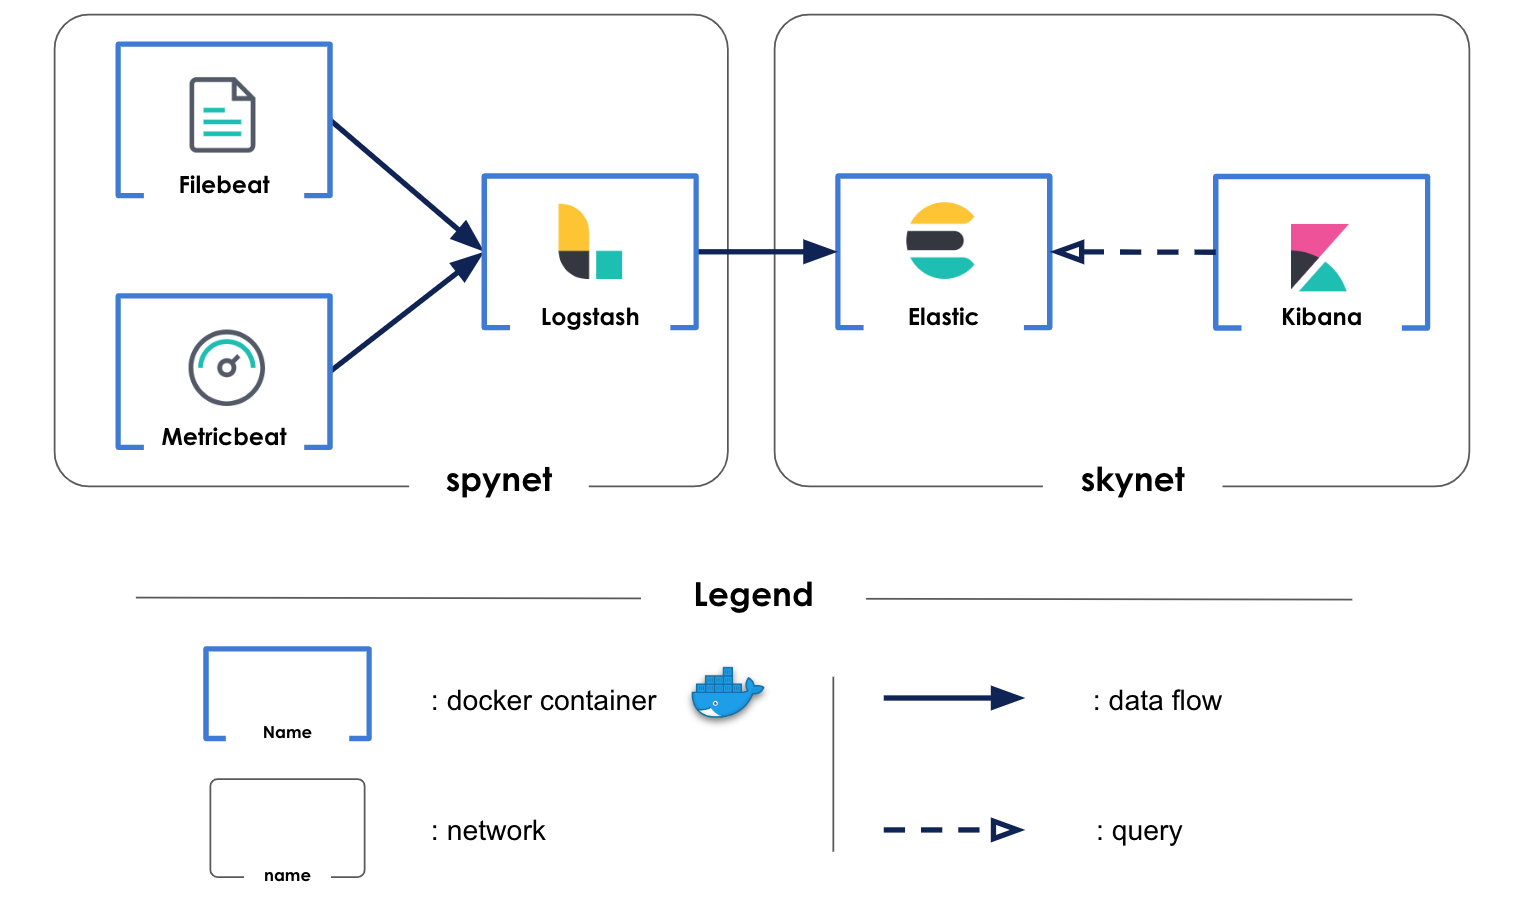
Five docker containers compone a monitoring plateform
Filebeat is a lightweight logs shipper. It is only used to recover logs from all docker containers.
Metricbeat is a lightweight metric shipper. It is only used to recover metrics from all docker containers.
Two logs files are created to gather informations about data loading in influxdb database. Logstash harvests, transforms and analyzes these logs and sends them to elasticsearch.
Metrics and logs from above-mentionned beat logs shippers are also retrieved by logstash but not processed. They are also sent to elasticsearch.
Elasticsearch stores and index data sent by logstash. Using logstash as output for beat logs shippers forces to load manually indexes templates. - filebeat-6.6.2-* is used for docker containers logs from filebeat - metricbeat-6.6.2-* is used for docker containers metrics from metricbeat - logstash-* is used for personal logs harvested by logstash itself
Kibana is used to display relevant dashboard. Two dashboard are uploaded in kibana.
The container_monitoring_dashboard allows to follow docker containers system metrics. It displays CPU, memory, number of container etc ...
The influxdb_monitoring_dashboard monitors the influxdb container. This dashboard displays influxdb's metrics. It adds two visualizations : - Nb input / time displays the total amount of data about to be stored during an injection along the time. - Nb output / time displays the total amount of data stored in the database during an injection along the time.
To load your own dashboard, follow the steps:
- create your visualizations with the kibana UI
- create your dashboard with the kibana UI using the visualizations you have created before
- download your dashboard's json format using the REST API:
curl -X GET "kibana.aura.healthcare.local:80/api/kibana/dashboards/export?dashboard=*id*" -H 'kbn-xsrf: true'
replace id by yout dashboard's id in kibana
- add the json script in a file in /kibana/files
- add a task in /kibana/tasks/run_container.yml (just copy paste a load task and change the file in the body module) to upload your dashboard in kibana each time you rebuild the stack.
