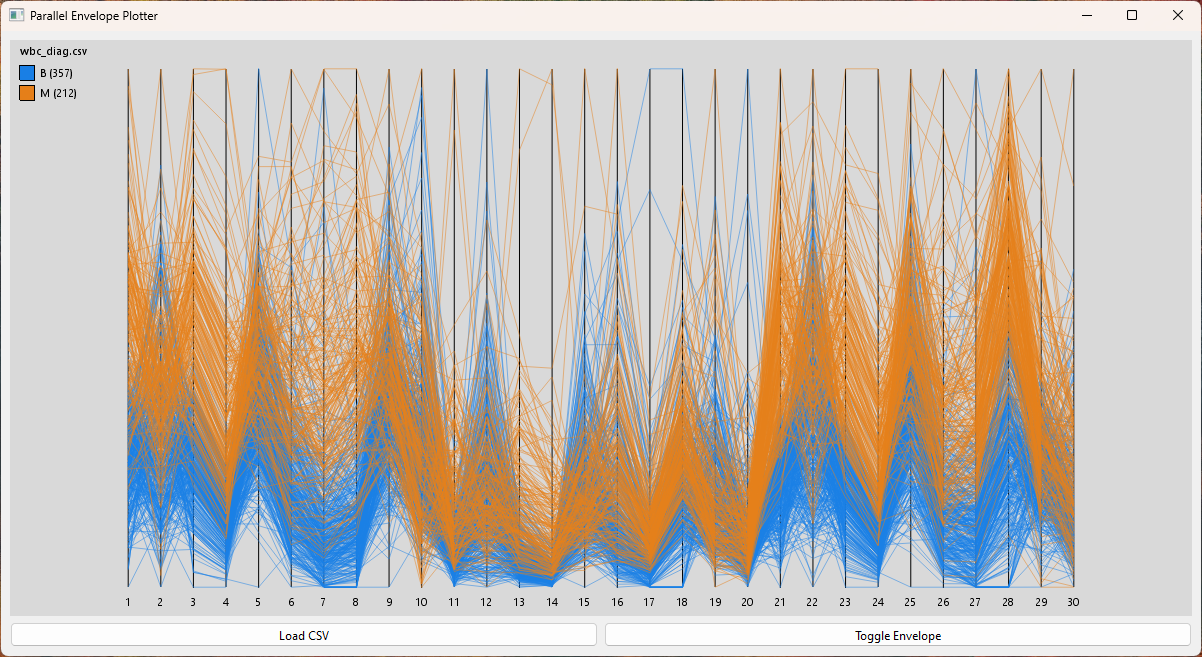
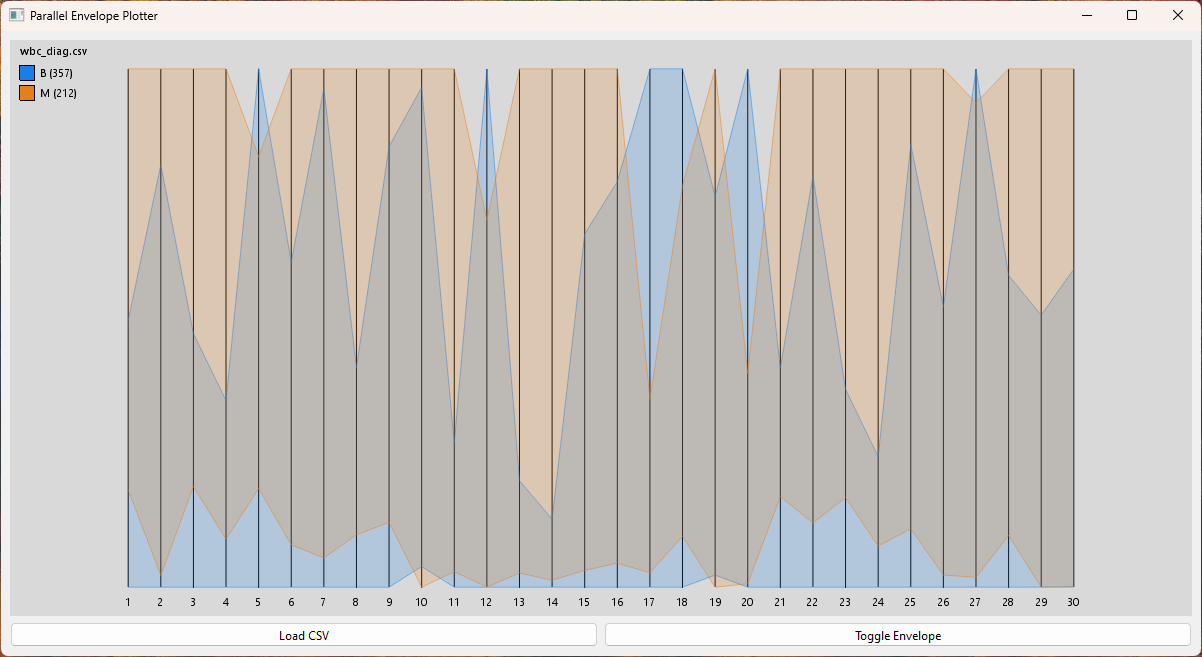
Parallel Coordinates visualization tool for multivariate CSV data and envelope exploration.
Current Features:
- Loads a dataset from a CSV file, the file must have a
classcolumn - Normalizes the dataset from [0, 1] and plots in Parallel Coordiantes
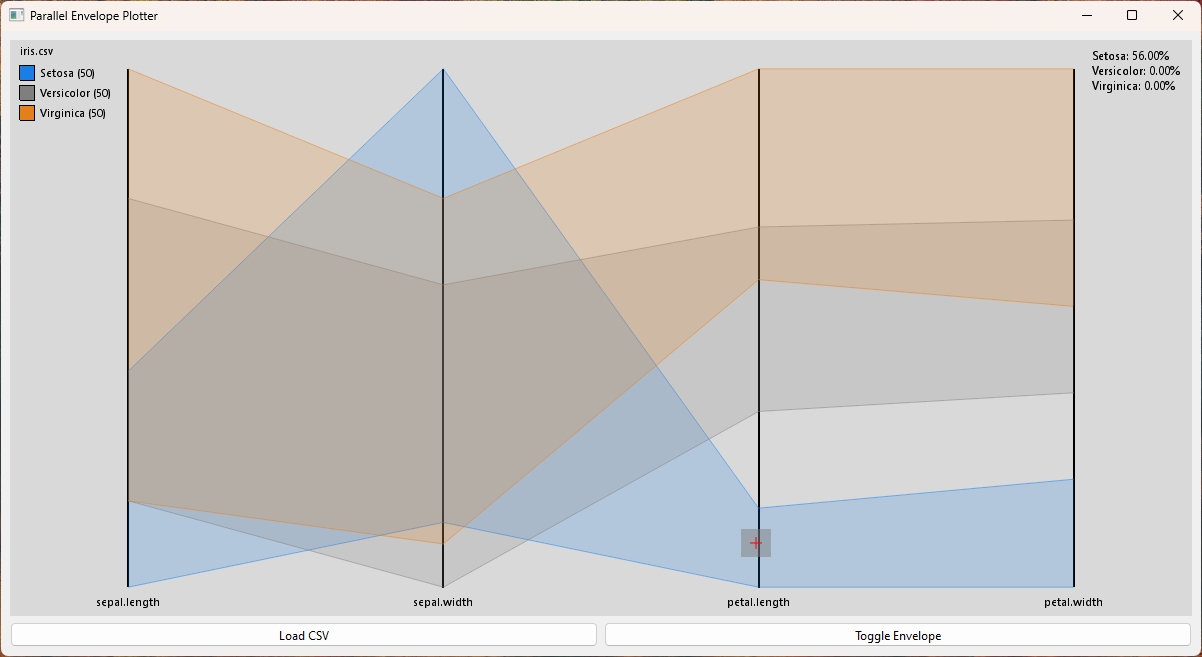
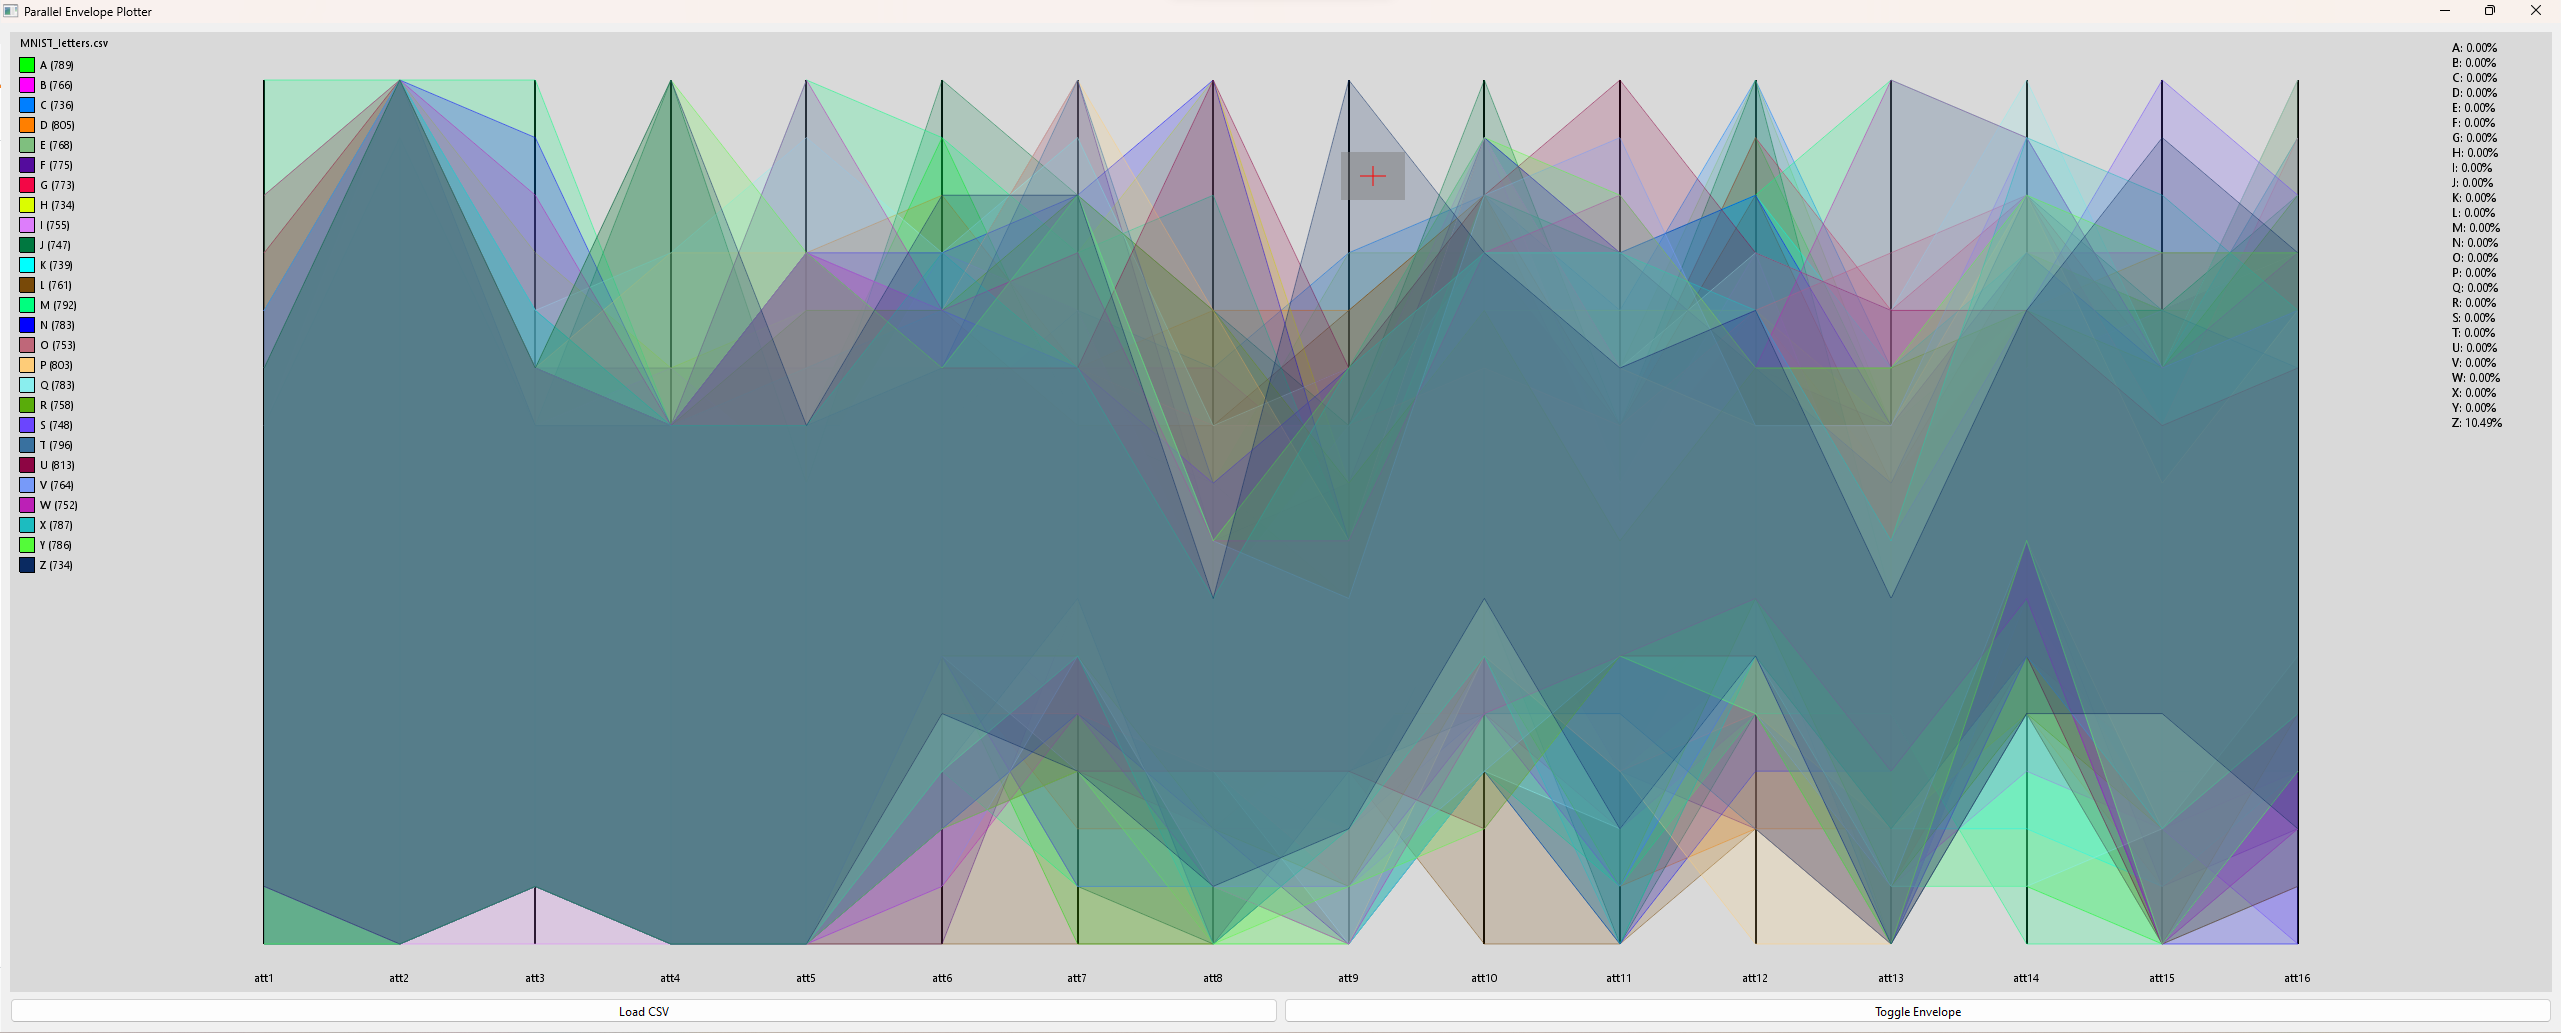
- Toggle button to outline envelopes of each classes minima and maxima
- Drag and drop a search rectange which can be resized with WASD or removed with right-click.
- Total percentage of cases per class within the search rectangle shown
- Escape or Ctrl+W keys to close the program
Plot examples of Wisconsin Breast Cancer Diagnosis dataset.


