With Kuwala, we want to enable the global liquid data economy. You probably also envision a future of smart cities, autonomously driving cars, and sustainable living. For all of that, we need to leverage the power of data. Unfortunately, many promising data projects fail, however. That's because too many resources are necessary for gathering and cleaning data. Kuwala supports you as a data engineer, data scientist, or business analyst to create a holistic view of your ecosystem by integrating third-party data seamlessly.
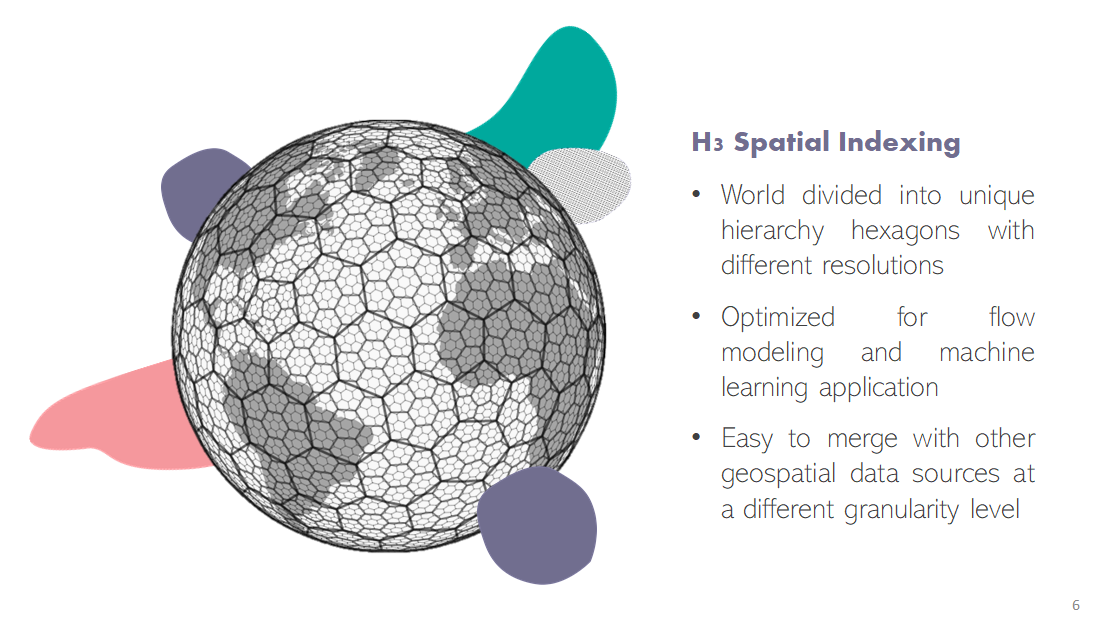
Kuwala explicitly focuses on integrating third-party data, so data that is not under your company's influence, e.g., weather or population information. To easily combine several domains, we further narrow it down to data with a geo-component which still includes many sources. For matching data on different aggregation levels, such as POIs to a moving thunderstorm, we leverage Uber's H3 spatial indexing.
Pipelines wrap individual data sources. Within the pipeline, raw data is cleaned and preprocessed. Then, the preprocessed data is loaded into a graph to establish connections between the different data points. Based on the graph, Kuwala will create a data lake from which you can load the data to a data warehouse, for example. Alternatively, it will also be possible to query the graph through a GraphQL endpoint.
Installed version of Docker and docker-compose (Go here for instructions)
- Change directory to
kuwala
cd kuwala- Build images
docker-compose build osm-poi population-density google-poi-api google-poi-pipeline neo4j neo4j-importer- Start databases
chmod +x ./scripts/init.sh./scripts/init.sh- Run pipelines to download and process data (in a new terminal window)
# Process population data
docker-compose run  population-density
# Process OSM POI data
docker-compose run --service-ports osm-poi start-processing:local- Load data into the graph
# Load data into graph database
docker-compose run  --service-ports neo4j-importer
For a more detailed explanation follow the
README under ./kuwala.
You can either query the graph database directly using Cypher, or you run individual REST APIs for the pipelines.
- Cypher to query Neo4j
- REST APIs on top of pipelines
# Run REST-API to query OSM POI data
docker-compose run  --service-ports osm-poi start-api:local
We are working on building out the core to load the combined data to a data lake directly and additionally have a single GraphQL endpoint.
The best first step to get involved is to join the Kuwala Community on Slack. There we discuss everything related to data integration and new pipelines. Every pipeline will be open-source. We entirely decide, based on you, our community, which sources to integrate. You can reach out to us on Slack or email to request a new pipeline or contribute yourself.
If you want to contribute yourself, you can use your choice's programming language and database technology. We have the only requirement that it is possible to run the pipeline locally and use Uber's H3 functionality to handle geographical transformations. We will then take the responsibility to maintain your pipeline.
Note: To submit a pull request, please fork the project and then submit a PR to the base repo.
By working together as a community of data enthusiasts, we can create a network of seamlessly integratable pipelines. It is now causing headaches to integrate third-party data into applications. But together, we will make it straightforward to combine, merge and enrich data sources for powerful models.
Based on the use-cases we have discussed in the community and potential users, we have identified a variety of data sources to connect with next:
Already structured data but not adapted to the Kuwala framework:
- Google Trends - https://github.com/GeneralMills/pytrends
- Instascraper - https://github.com/chris-greening/instascrape
- GDELT - https://www.gdeltproject.org/
- Worldwide Administrative boundaries - https://index.okfn.org/dataset/boundaries/
- Worldwide scaled calendar events (e.g. bank holidays, school holidays) - https://github.com/commenthol/date-holidays
Unstructured data becomes structured data:
- Building Footprints from satellite images
Data we would like to integrate, but a scalable approach is still missing:
- Small scale events (e.g., a festival, movie premiere, nightclub events)
To use our published pipelines clone this repository and navigate to
./kuwala/pipelines. There is a separate README
for each pipeline on how to get started with it.
We currently have the following pipelines published:
osm-poi: Global collection of point of interests (POIs)population-density: Detailed population and demographic datagoogle-poi: Scraping API to retrieve POI information from Google (incl. popularity score)


