some code to help visualize maps of complex numbers.
the core functionality is defined in complex_vis.py and showcased in demo.ipynb.
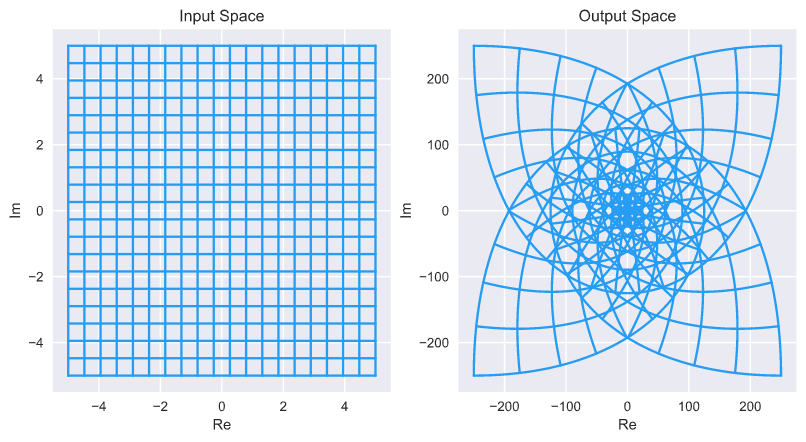
as an example, this is the input-output graph of f(z) = z^3
and this is the 'domain-colored' graph of a funky rational function:

