Analysis repo to generate tables, figures for manuscript on the OpenABM-Covid19 model (Hinch, Probert et al., 2020).
To generate the data, one needs to install OpenABM-Covid19, the requirements for which are listed on the README.md of the OpenABM-Covid19 repo. For generation of the figures and tables in this repo, one needs Python>3.6 (other package requirements should be satisfied if OpenABM is already running) and R >3.4.
The scripts herein assume OpenABM-Covid19 is cloned as a subdirectory of this repo (or it could be pulled using git submodule, for instance).
model_dir="OpenABM-Covid19"
release="0.3"

cd OpenABM-Covid19-model-paper
git clone https://github.com/BDI-pathogens/OpenABM-Covid19.git "$model_dir"
(cd "$model_dir"; git checkout "$release")
We recommend running these analyses with a Python virtual environment. A virtual environment can be set up, activated, and prerequisites installed in the following manner:
python3 -m venv venv
source venv/bin/activate
pip install -r "$model_dir/tests/requirements.txt"
(cd $model_dir/src; make clean; make)
The virtual environment can be deactivated using deactivate.
make all: Will generate the simulated data, and generate all figures and tables used in the paper.make all_output: Generate all figures and tables used in the paper (without generating the simulated data).
Additional commands
make data: Generate simulation data for a population of 1M with UK-like demographics and controls (self-isolation on symptoms, self-isolate on positive test result, lockdown when prevalence reaches 2% in the population).
All figures and tables can be generated individually in the following manner (after the data have been generated):
make figure1: Generate figure 1, etcmake figureS1: Generate figure S1, etcmake table1: Generate table 1, etc
Figure 1 is a schematic of the networks used in the model.
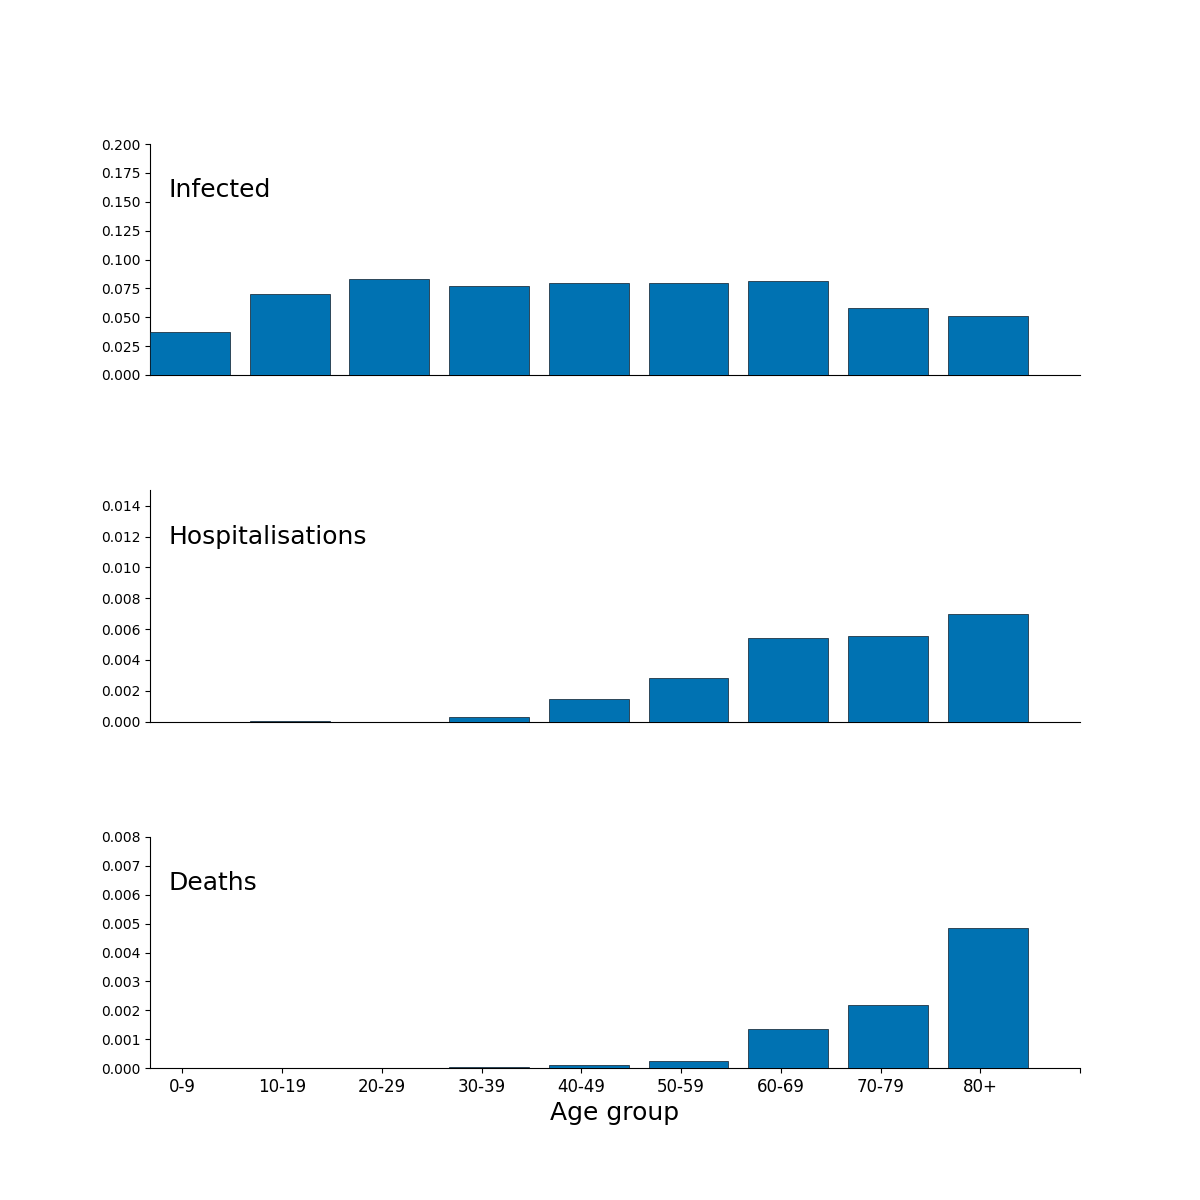
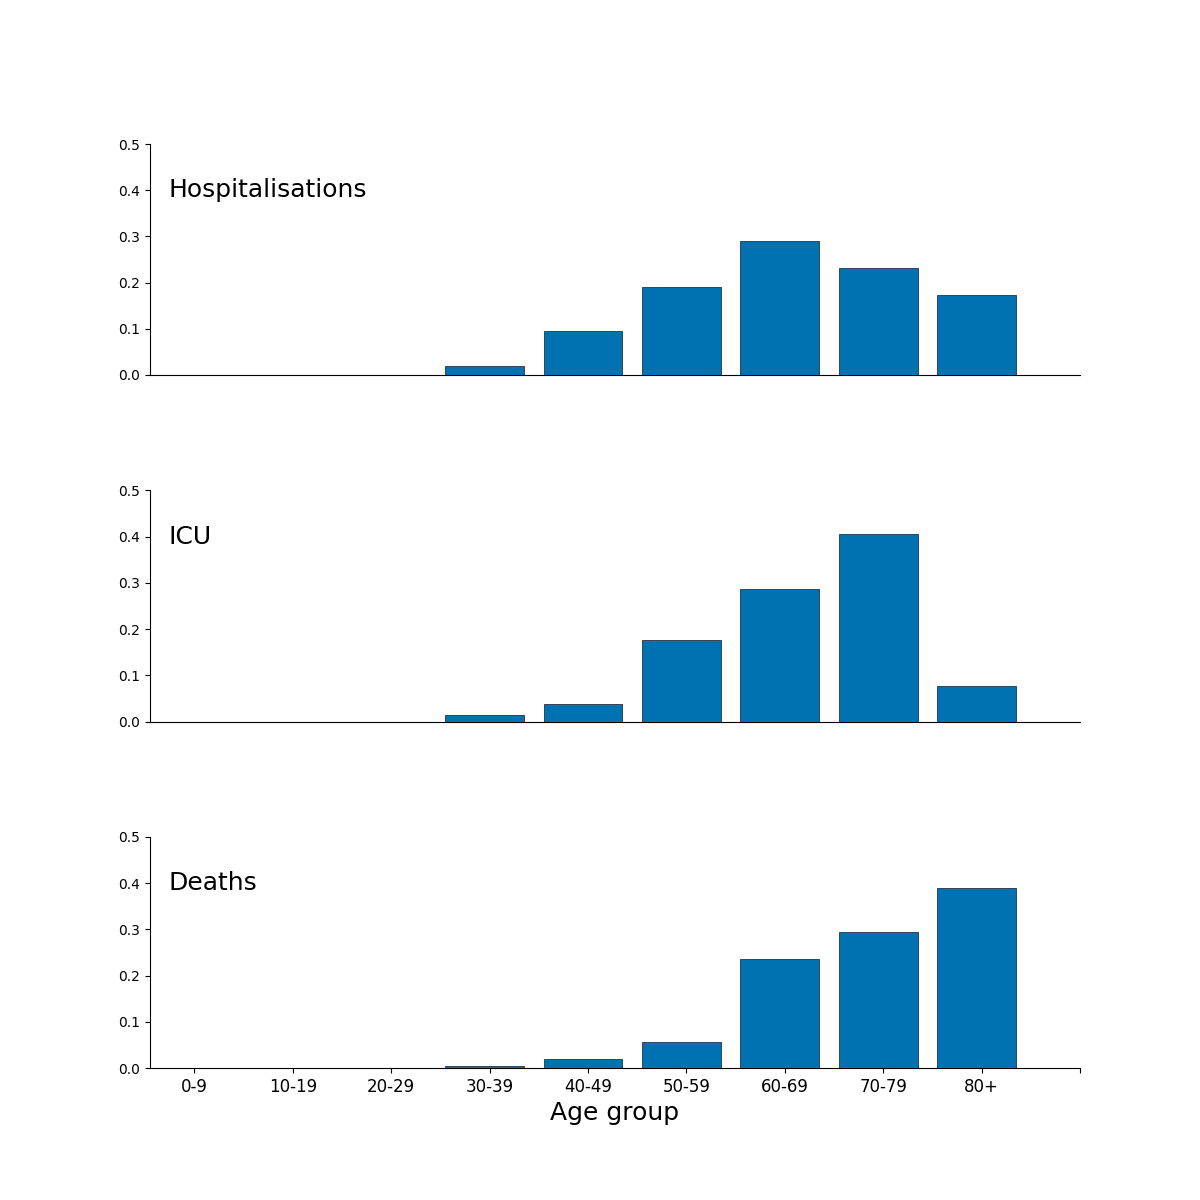
Figure 2 is a composite figure, the subpanels are produced in this repository
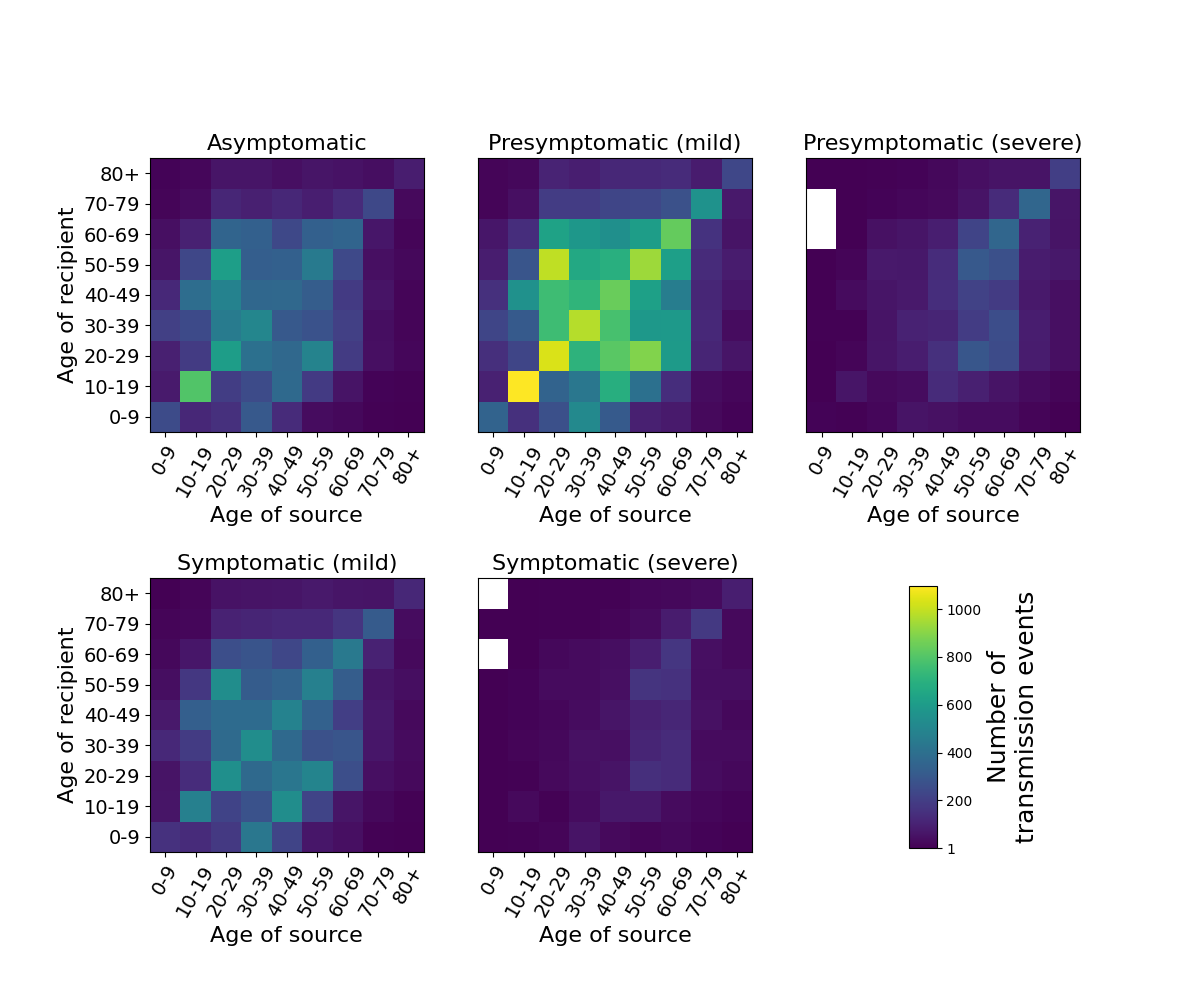
Heatmap of transmission events between different age groups for different infectiousness states of the source of infection. Data is from a single simulation in a population of 1 million individuals with UK-like demographics and COVID19 control interventions.
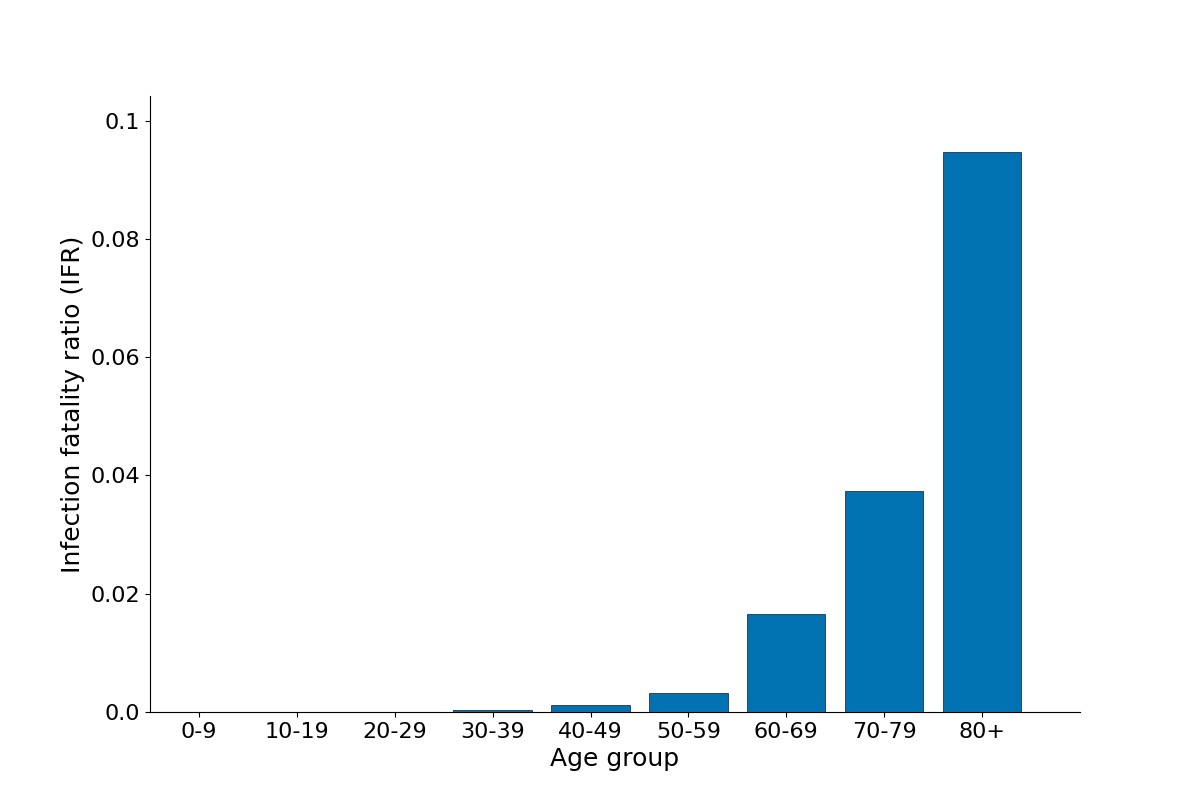
Age-stratified infection fatality ratio as output from a single simulation in a population of 1 million with UK-like demography and control interventions.
Figure 5 is a fit of the model using baseline parameters to observed data for England and Wales (using minimal calibration).
Figure 6 is a schematic representation of the different infectiousness and disease compartments in the model.
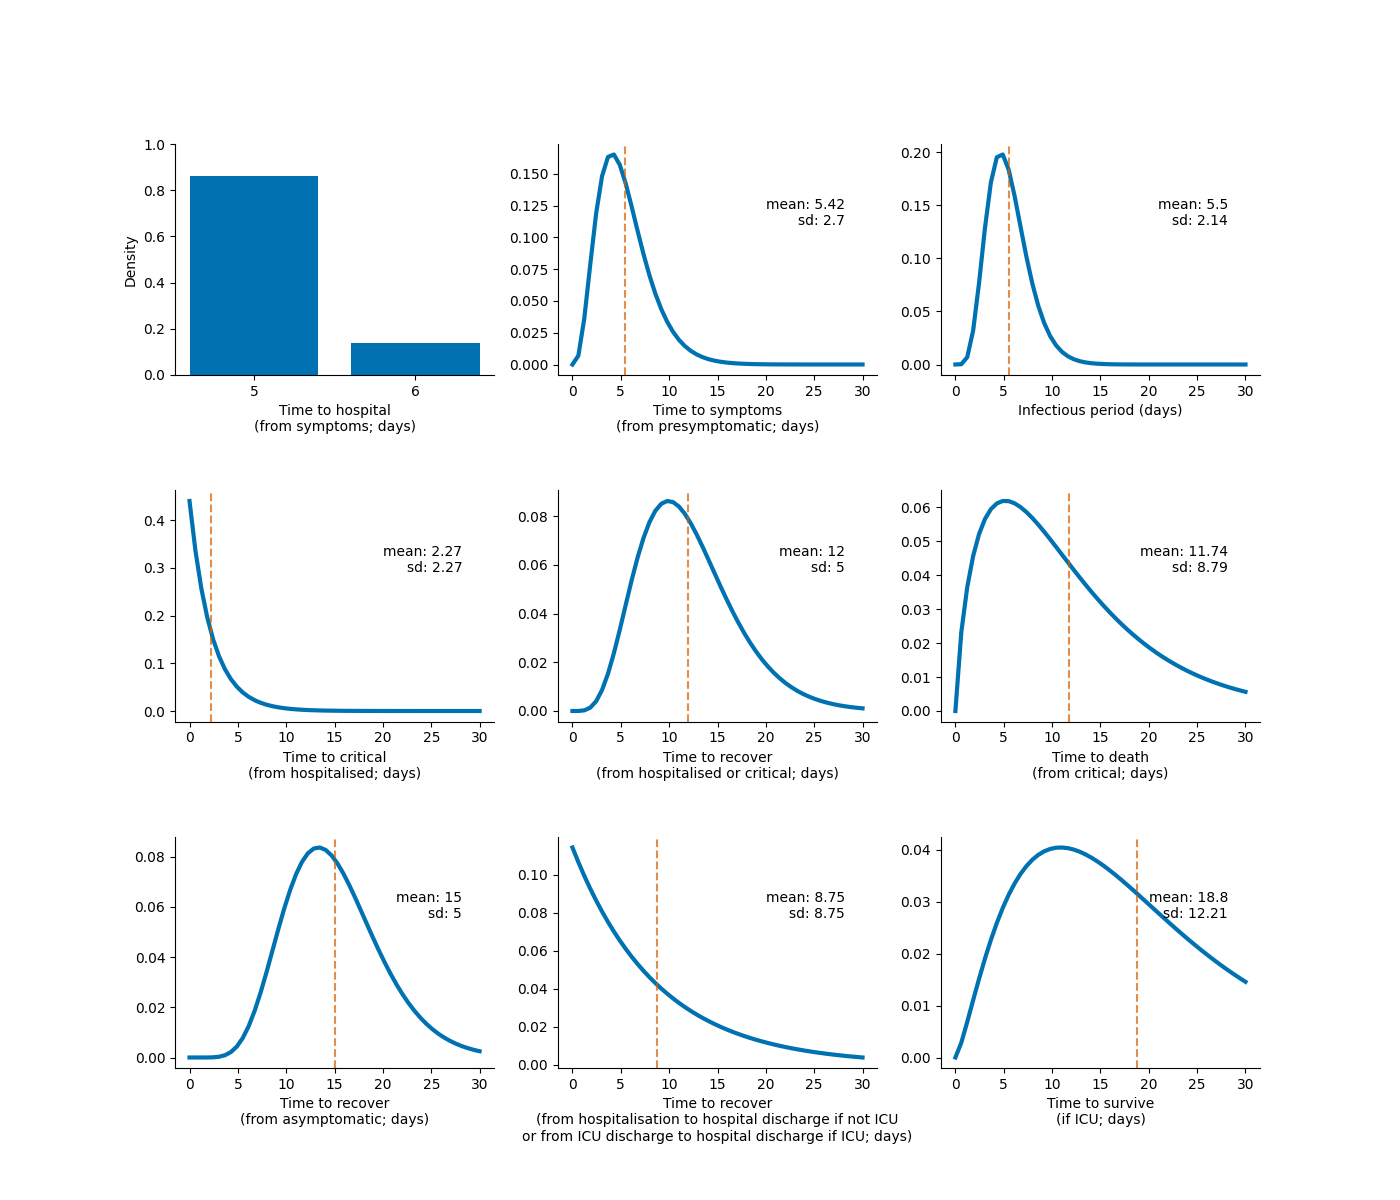
Waiting time distributions for transitions between infection and disease states.
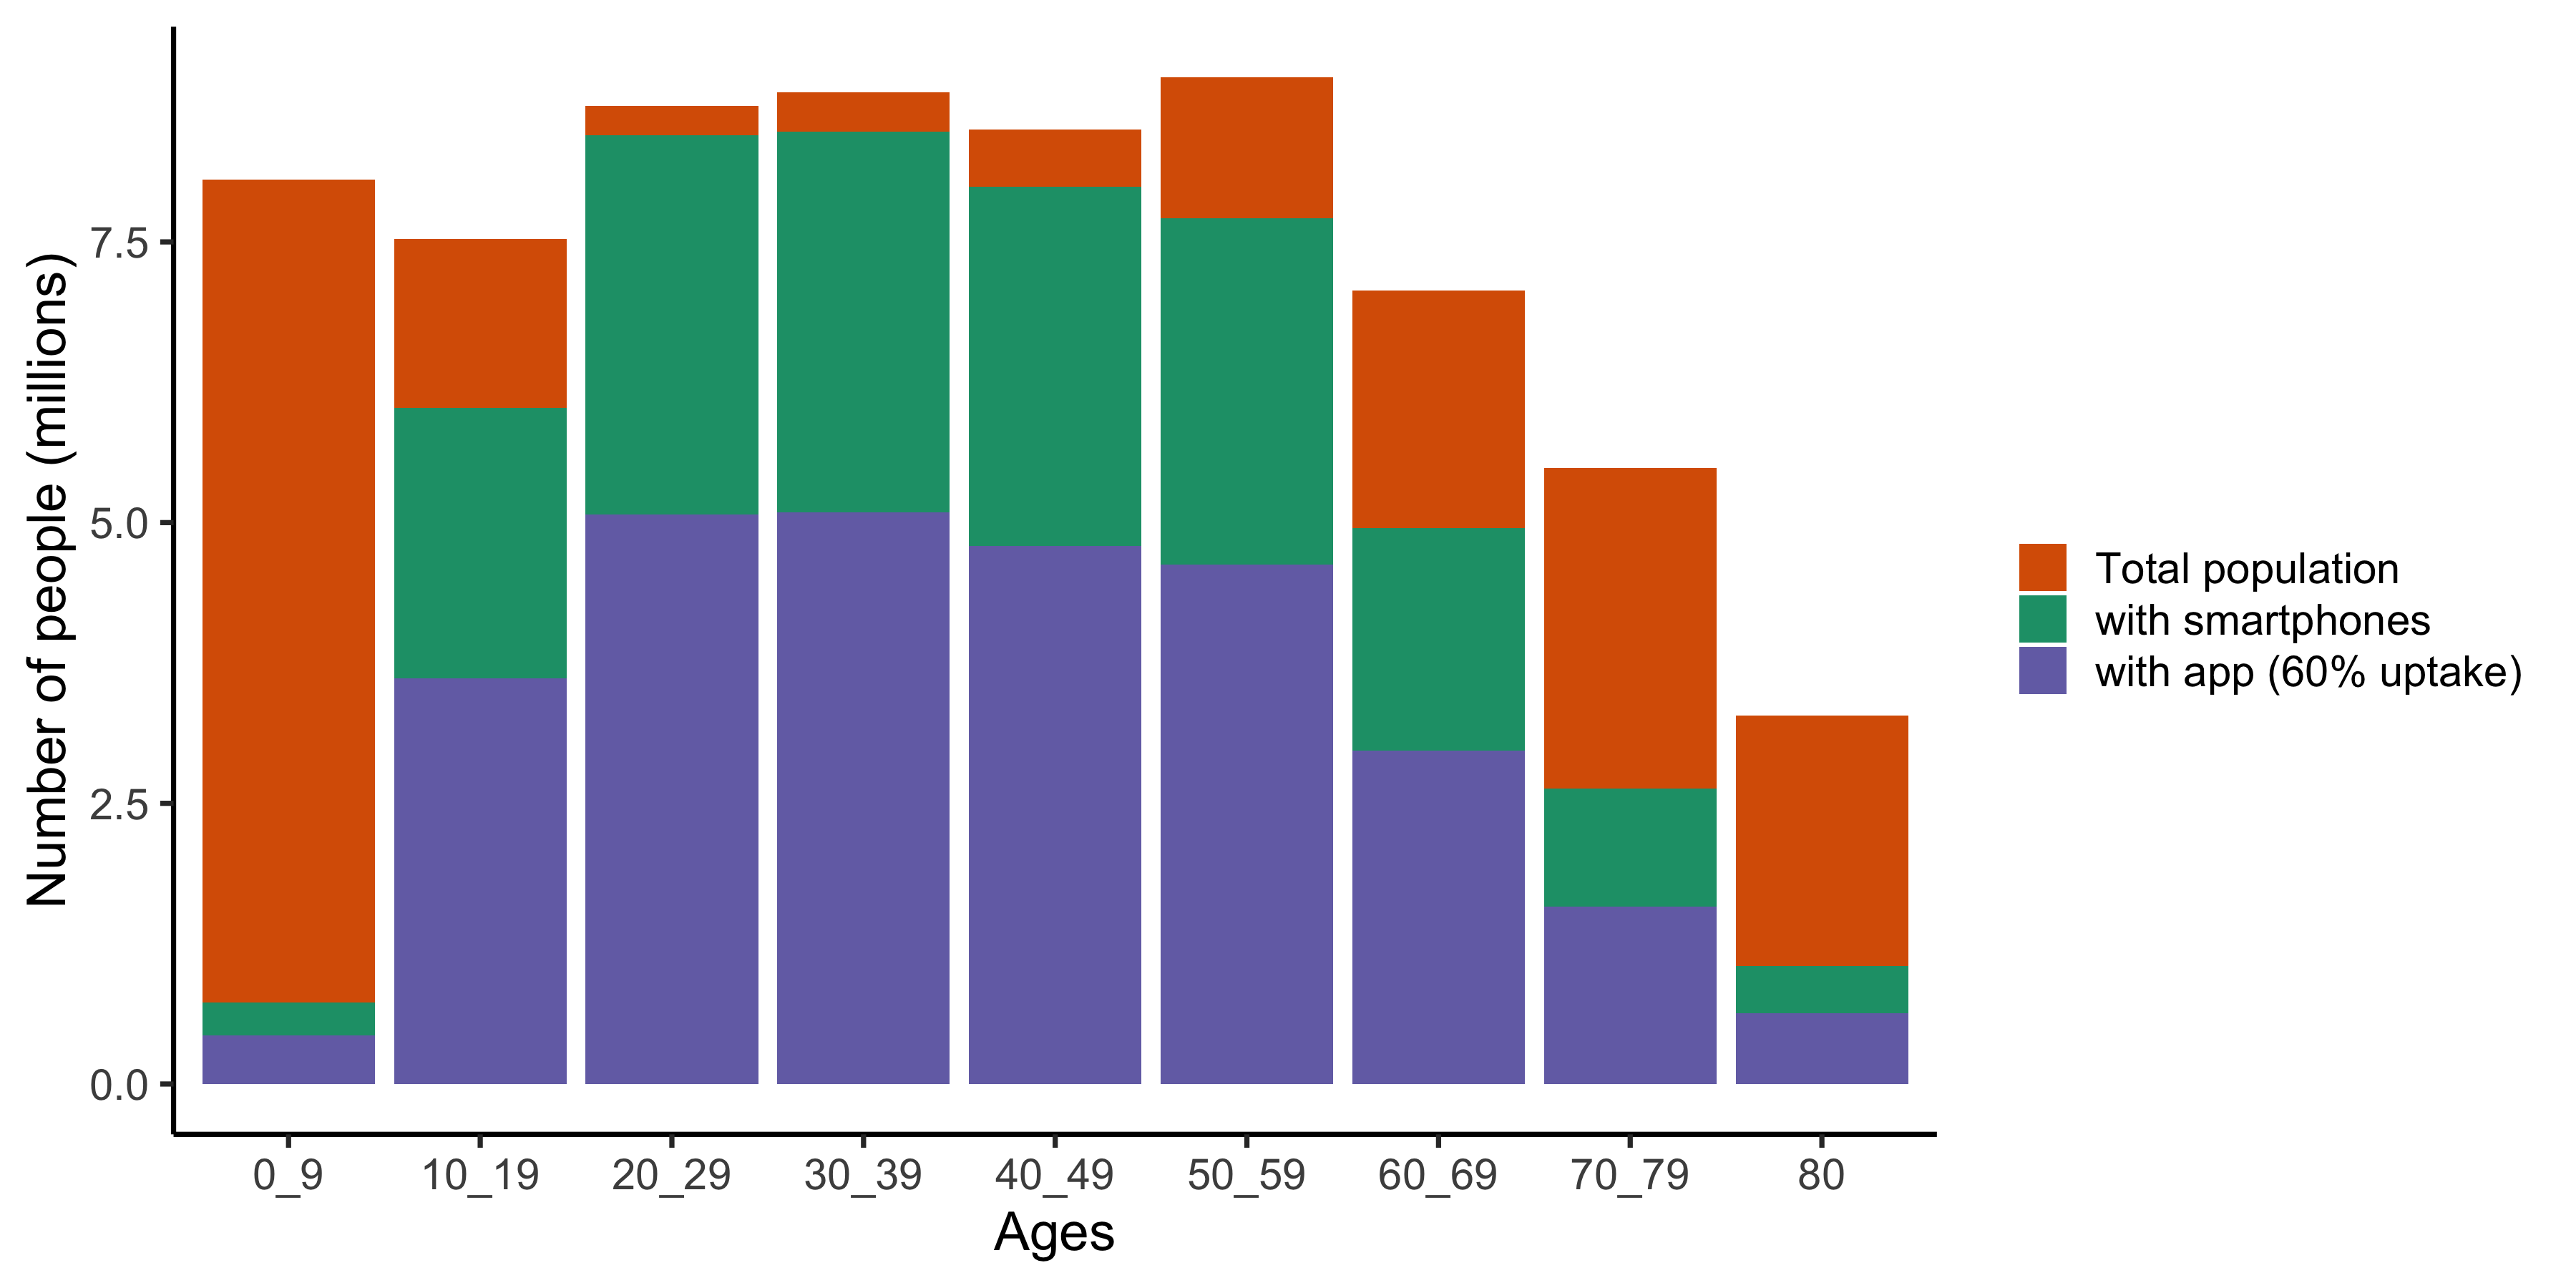
App uptake
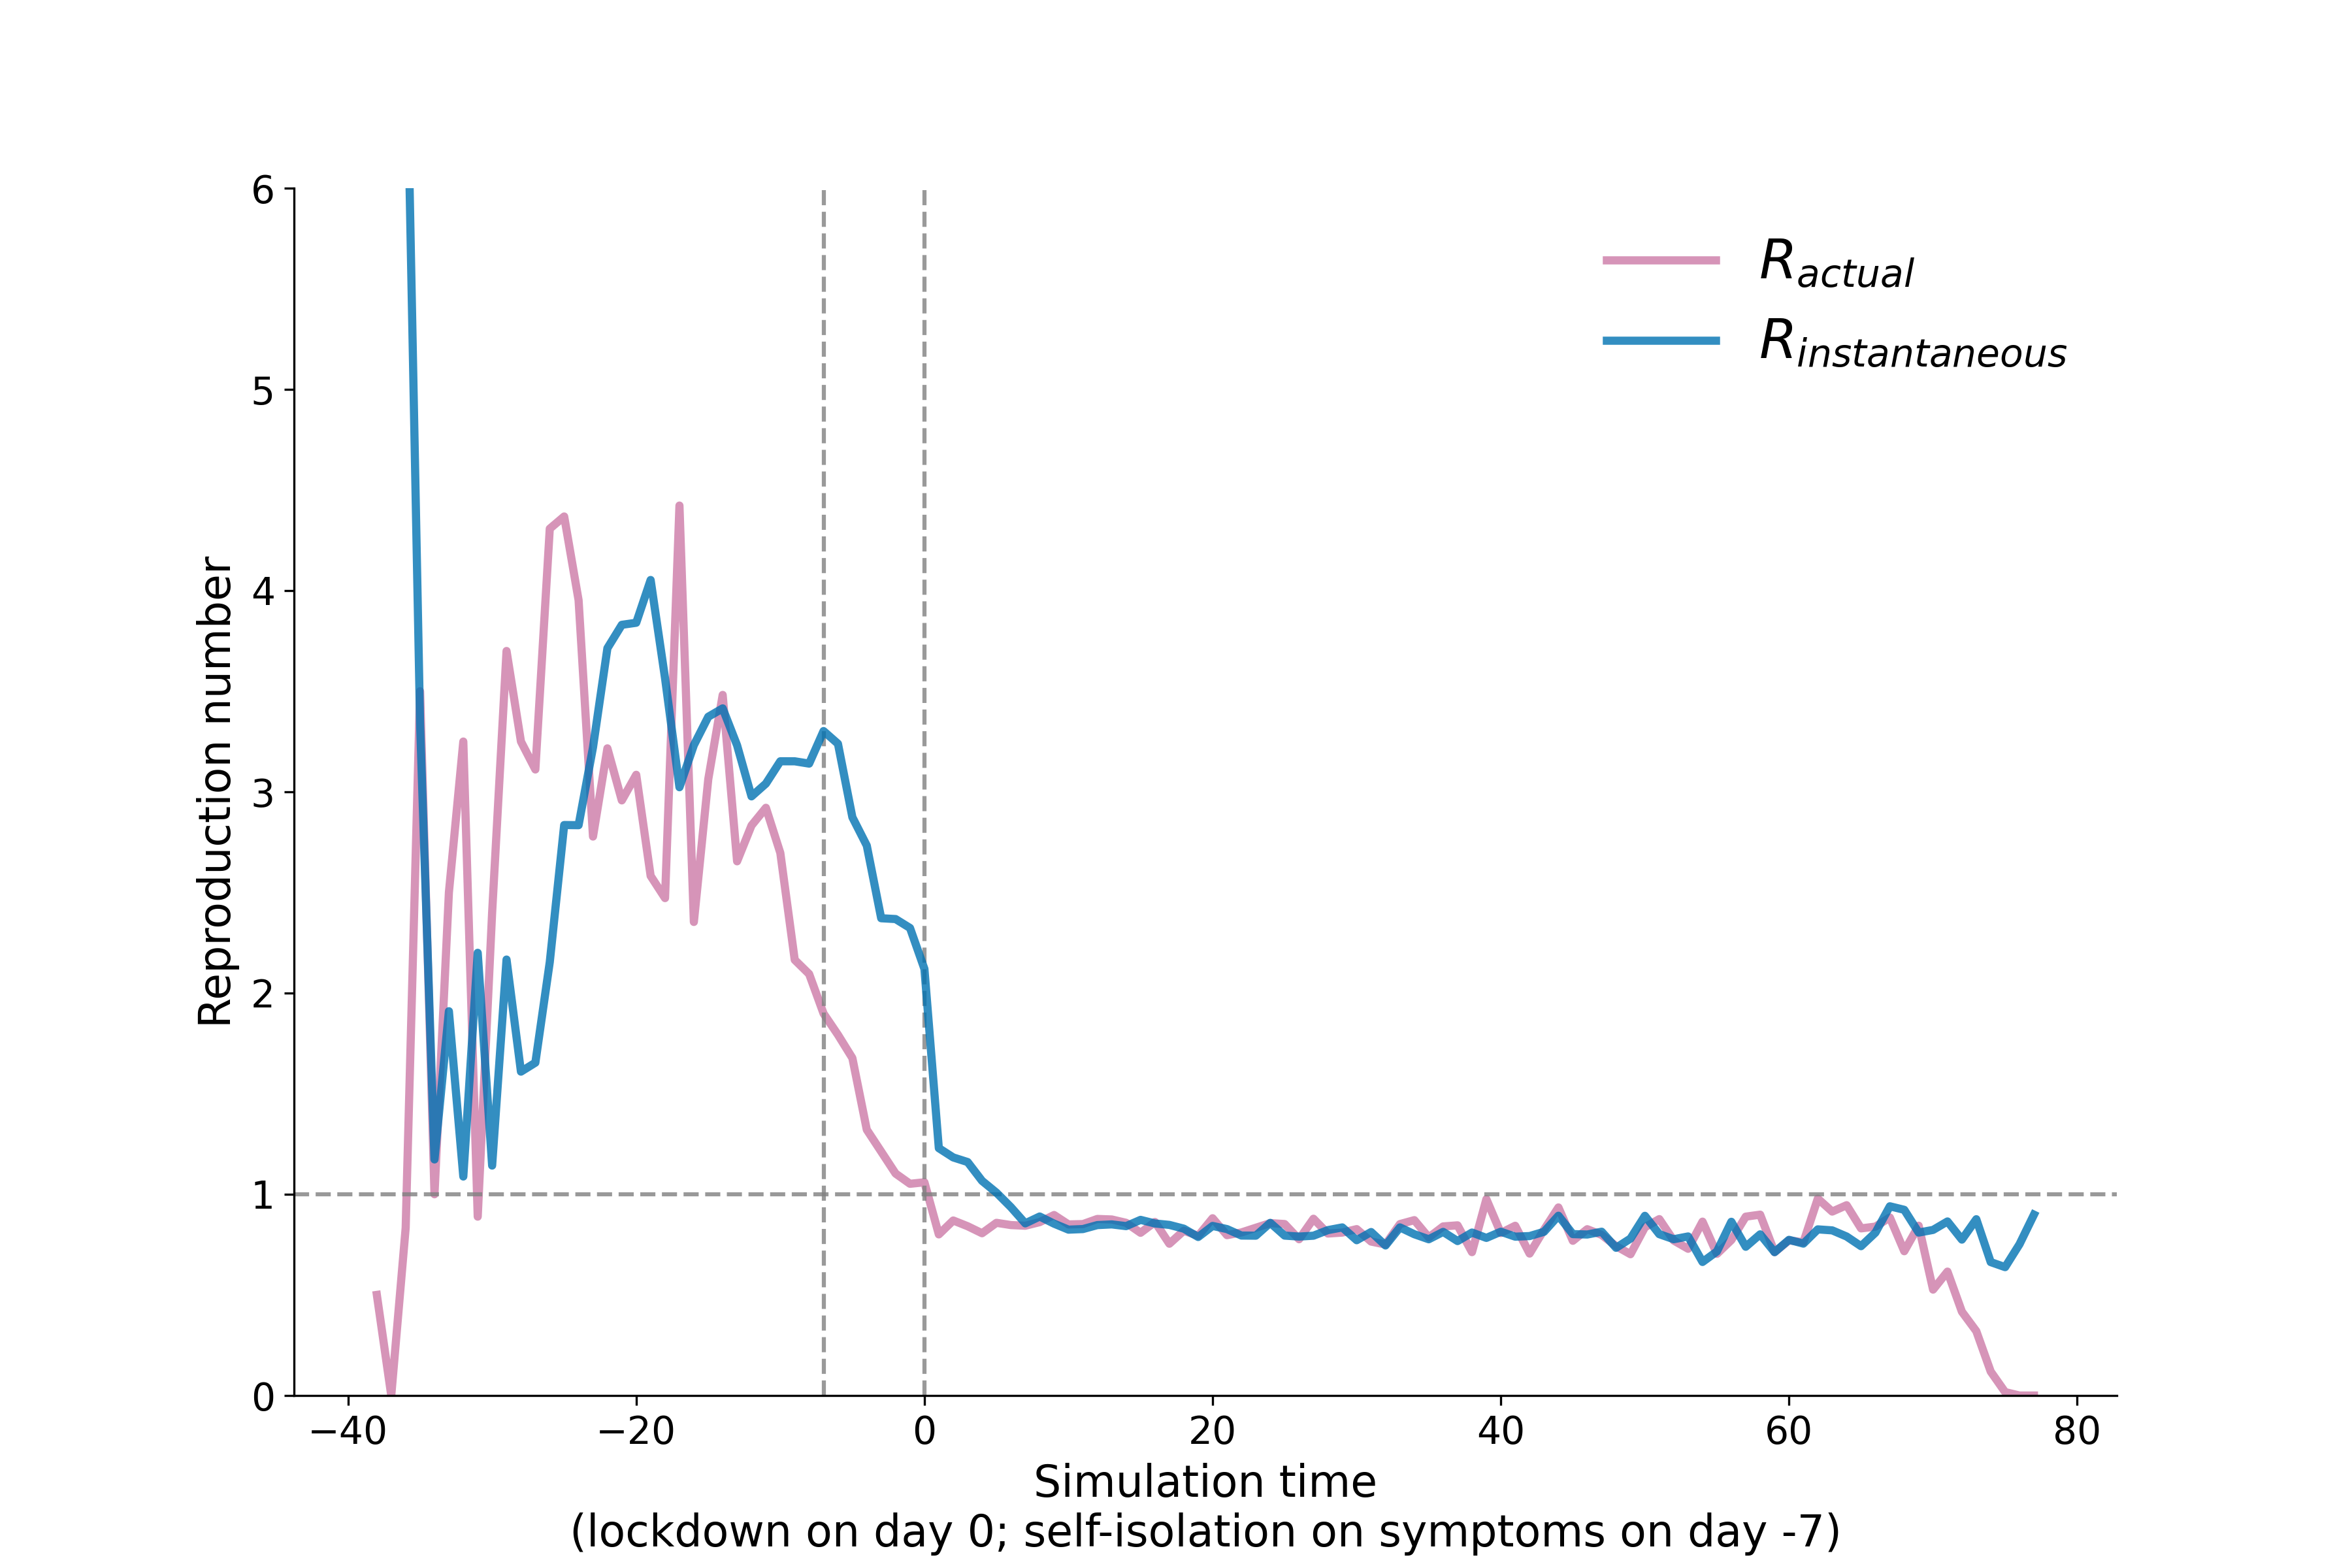
Reproduction number calculated from the transmission file and timeseries file
