This project is a replication and implementation in Julia v1.3.1 of Hastings & Powell (1991), a classic paper in ecological modelling. Full reference to the original article:
Hastings, A., & Powell, T. (1991). Chaos in a Three-Species Food Chain. Ecology, 72(3), 896–903. https://doi.org/10.2307/1940591
The goal of this project was to test if the results of the original paper could be reproduced, as well as to provide a fully reproducible version for it on GitHub.
The reproduction was successful for all important results and was published in ReScience C (also archived on Zenodo). The open review is available here.
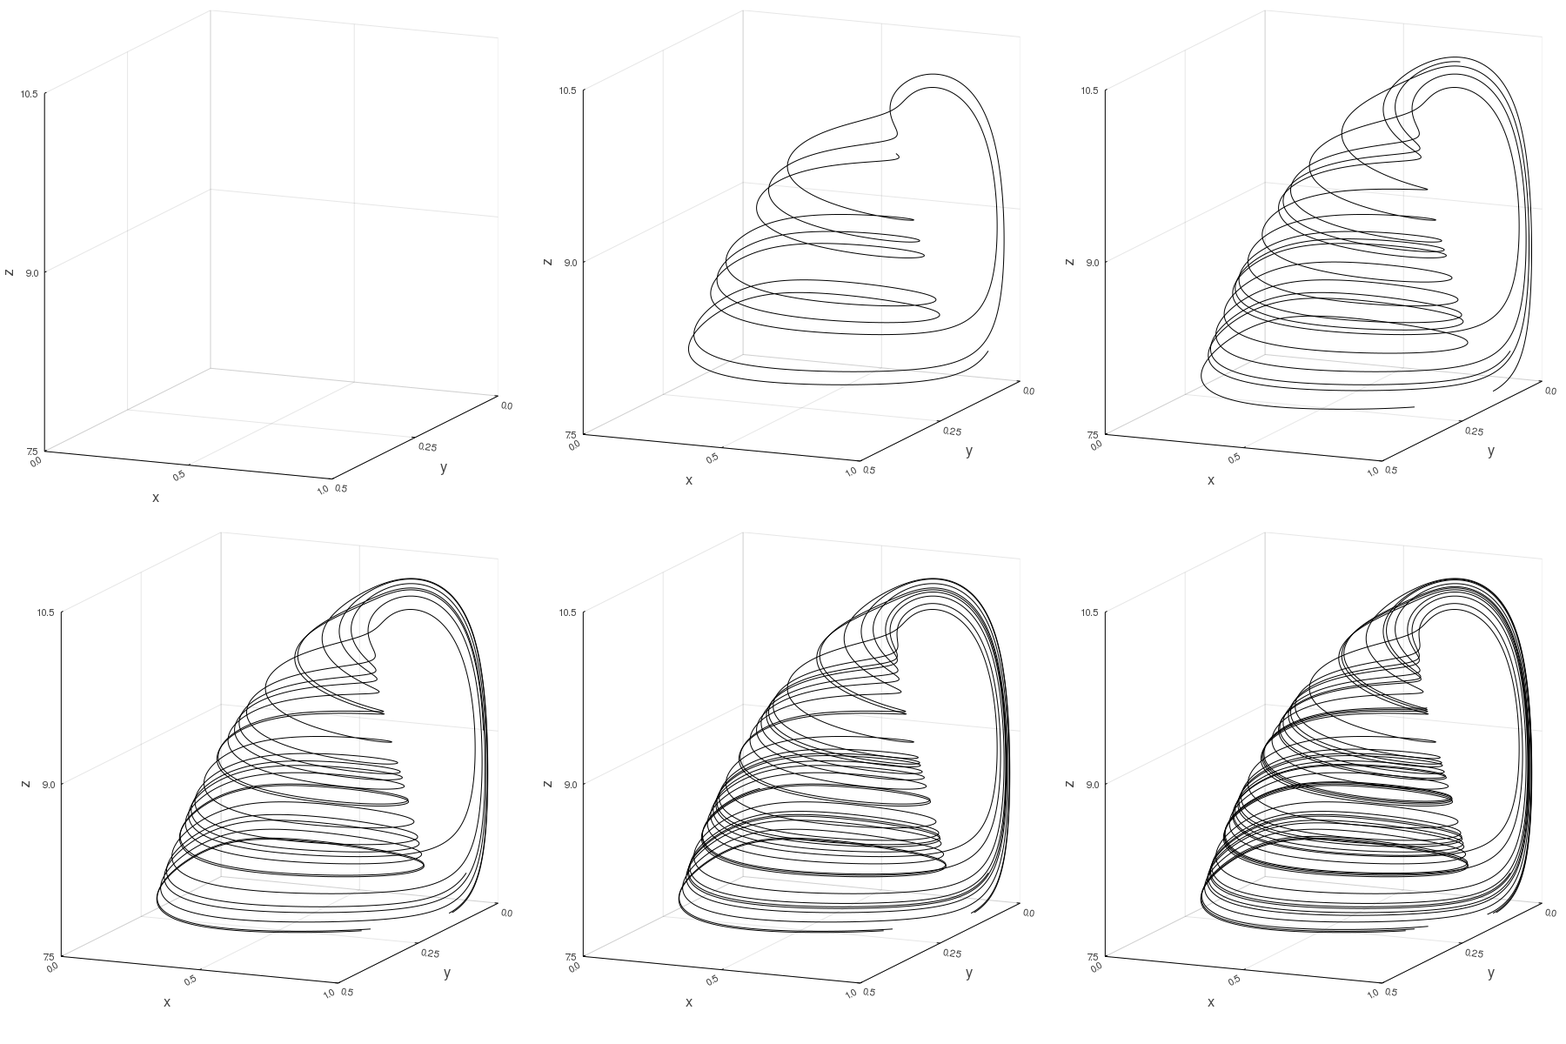
As a bonus, we represented the dynamics of the three-species system in the following animated 3D GIF:
All the scripts required to reproduce the model are in the code/ subfolder.
They assume that code/ is used as the working directory.
To reproduce our project, we recommend the following steps as initial setup, assuming Julia v1.3.1 is already installed:
- Clone this repository
git clone https://github.com/BIO6032/2019_replication_HastingsPowell_1991.git
- Launch Julia in the repository, then set
code/as the working directory:
cd("code")- Run the following commands to install the exact versions of packages (as specified in the Project Environment)
import Pkg; Pkg.activate(".")
Pkg.instantiate()After setup, main.jl can be run to reproduce all figures in a single call.
include("main.jl") # make sure you ran cd("code") to set the correct working directoryNote that this is not an especially intensive task. On an ordinary laptop, it takes about 1 minute, 2.00 GB of memory and uses a single core. However, if using the packages for the first time, precompiling may take an additional 5 minutes (Julia has to do this after installing or changing versions).
Alternatively, individual scripts in code/ (producing one figure each) can be run separately, either line-by-line in a terminal or through a Julia IDE, such as Juno or Julia for VS Code. However, be sure to run these lines from main.jl first:
import Pkg; Pkg.activate(".")
using DifferentialEquations
using Plots
include("HPmodel.jl")
The GIF can be reproduced by running the figure2D-gif.jl script. This is longer than for the core figures and takes about 8-10 minutes.
include("figure2D-gif.jl")┌ Warning: dt <= dtmin. Aborting. There is either an error in your model specification or the true solution is unstable.
└ @ DiffEqBase ~/.julia/packages/DiffEqBase/gTsoC/src/integrator_interface.jl:333
- This warning is expected in the
code/figure4.jlandcode/figureS1.jlscripts. It will be repeated a few times, as the model does not converge to a solution for a few higher parameter values. We chose to leave it as is to warn potential users at this.
GKS: Open failed in routine OPEN_WS
GKS: GKS not in proper state. GKS must be either in the state WSOP or WSAC in routine ACTIVATE_WS
GKS: can't connect to GKS socket application
Did you start 'gksqt'?
- This graphics display error sometimes happens on Linux, but the figures should be produced anyways. It can likely be fixed by installing additional dependencies -- see this issue.
Our article uses the ReScience C journal template. All elements are in the article/ subfolder. Instructions to reproduce the article are provided in the subfolder README.
