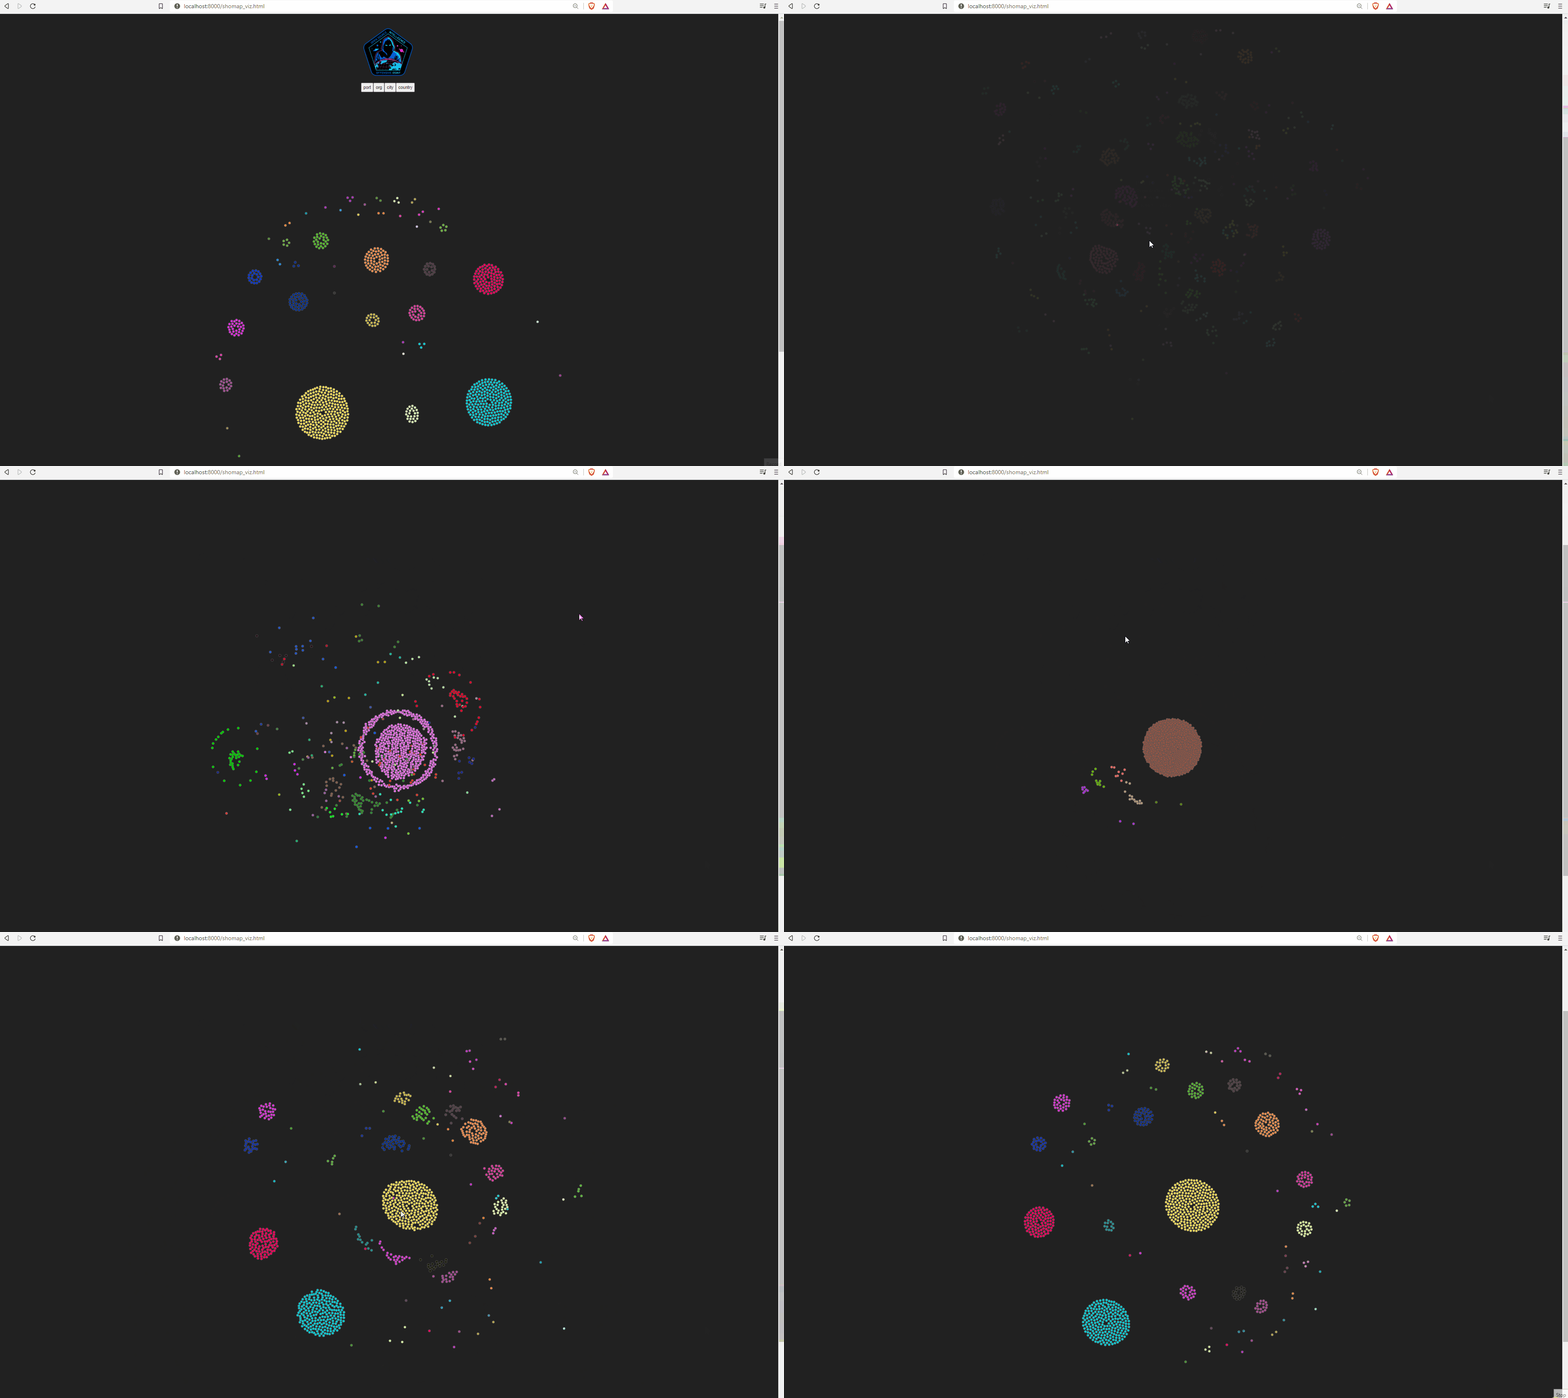
Put .json file that is a json key : json array of single line shodan results named shodata.json into this directory and run python3 shomap.py to visualize and group it accordingly by port, country, city or ISP.
article - https://offensiveosint.io/offensive-osint-s03-e07-shomap-advanced-shodan-visualization
Redacted viz - https://woj-ciech.github.io/Shomap/shomap_viz_example.html
└─# git clone https://github.com/bedrovelsen/shomap
└─# cd Shomap
└─# python3 shodata.json
└─# python3 shomap.py                                                                                                                                            130 ⨯

    ,-:` \;',`'-,
  .'-;_,;  ':-;_,'.
 /;   '/    ,  _`.-\
| '`. (`     /` ` \`|
|:.  `\`-.   \_   / |
|     (   `,  .`\ ;'|
 \     | .'     `-'/
  `.   ;/        .'
jgs `'-._____.

usage: shomap.py [-h]

Create visualization out of Shodan query

optional arguments:
  -h, --help            show this help message and exit
└─# python3 shomap.py
In the same directory run http server
└─# python3 -m http.server
Navigate to localhost:8080/shomap_viz.html
