Mapping_Earthquakes
Mapping Earthquakes with JavaScript & APIs
Project Overview
Create interactive maps using JavaScript and the D3 library to traverse and retrieve GeoJSON earthquake and tectonic plate data from the past 7 days, where the magnitude of the earthquake is displayed on circles that vary in size and color according to its strength, which details can be seen on a popup box upon clicking. As well, as the Leaflet library to plot the data on a Mapbox map through an API request.
Design Solution
- Use Github:
- Create branches from the main branch
- Add, commit, and push data to Github branches.
- Merge branches with the main branch.
- Retrieve data from a GeoJSON file.
- Make API requests to a server to host geographical maps with
- Populate geographical maps with GeoJSON data using JavaScript and the Data-Driven Documents (D3) library.
- Add multiple map layers to geographical maps using Leaflet control plugins to add user interface controls.
- Use JavaScript ES6 functions to add GeoJSON data, features, and interactivity to maps.
- Render maps on a local server.
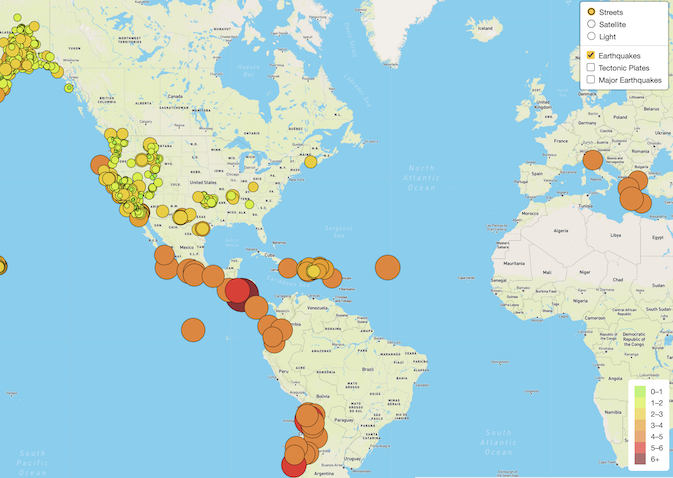
All Earthquakes
- All Earthquakes from the past 7 days are displayed in the Streets map style:
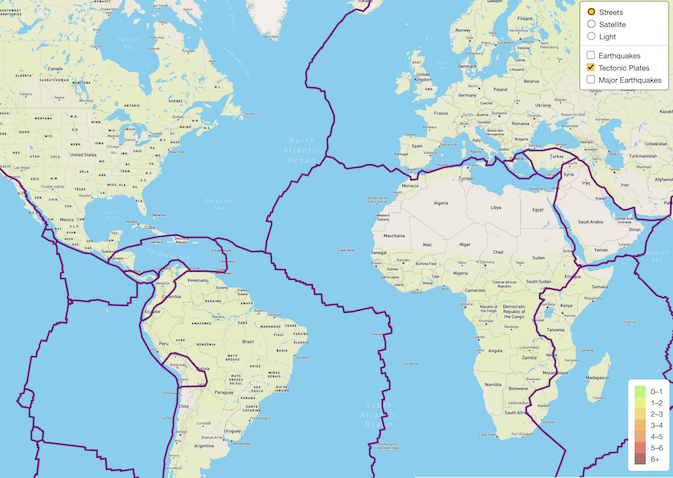
Tectonic Plates
- Tectonic plates on the Streets map style.
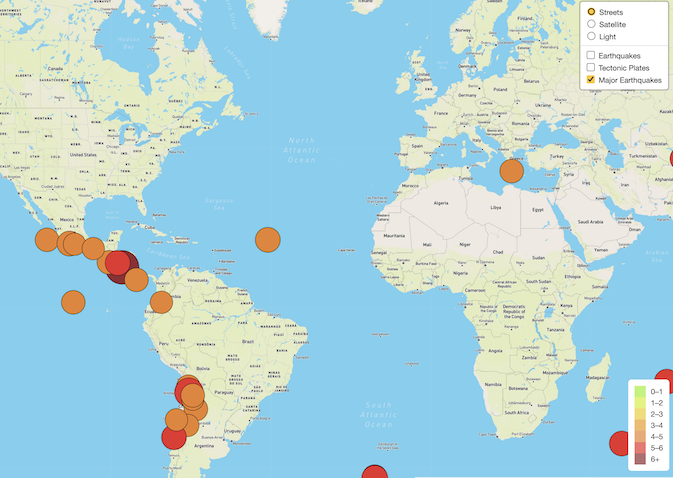
Major Earthquakes
- Only Earthquakes with a magnitude of 4.5 and above from the past 7 days, are displayed in the Streets map style:
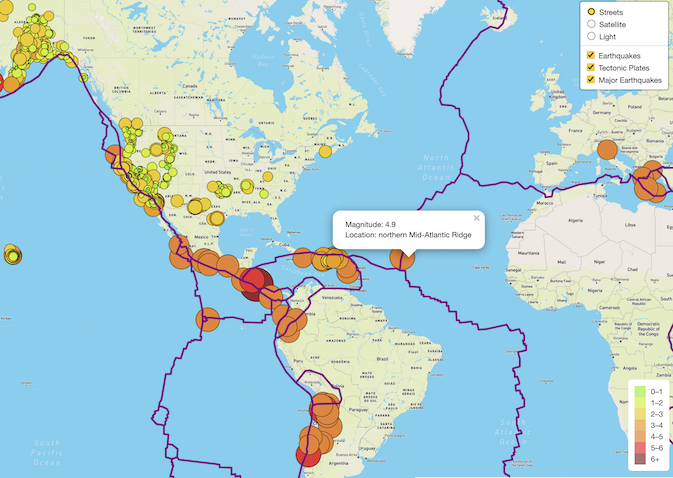
Streets Map Style with a Popup Box
- All the datasets were selected and displayed in the Street map style, with the popup box of the circle containing the details of that earthquake:
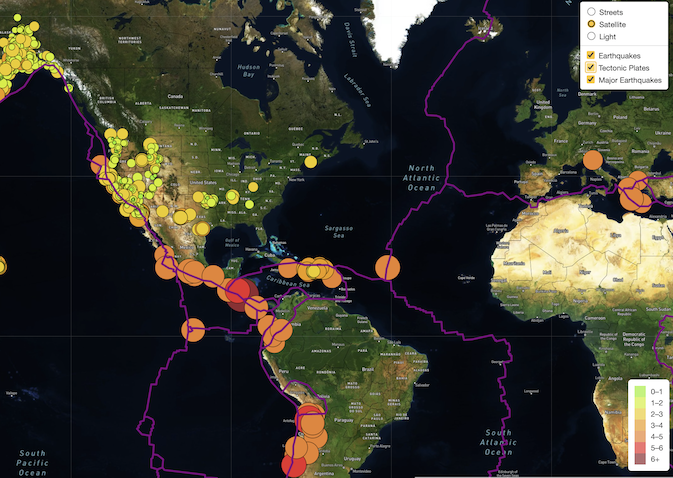
Satellite Map Style
- All the datasets were selected and displayed in the Satellite map style:
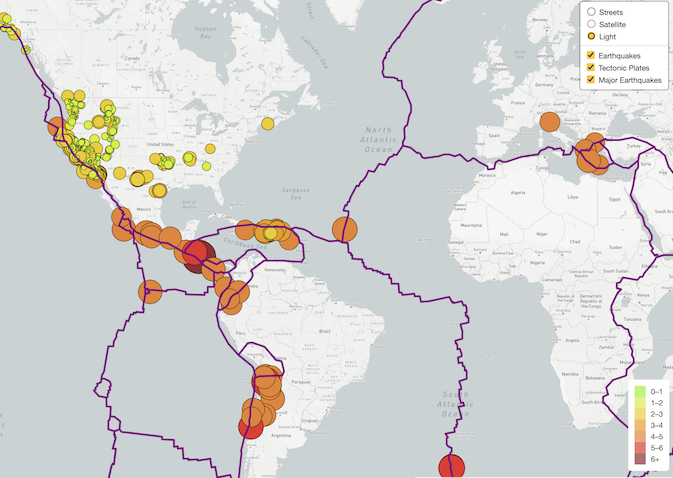
Light Map Style
- All the datasets were selected and displayed in the Light map style:
