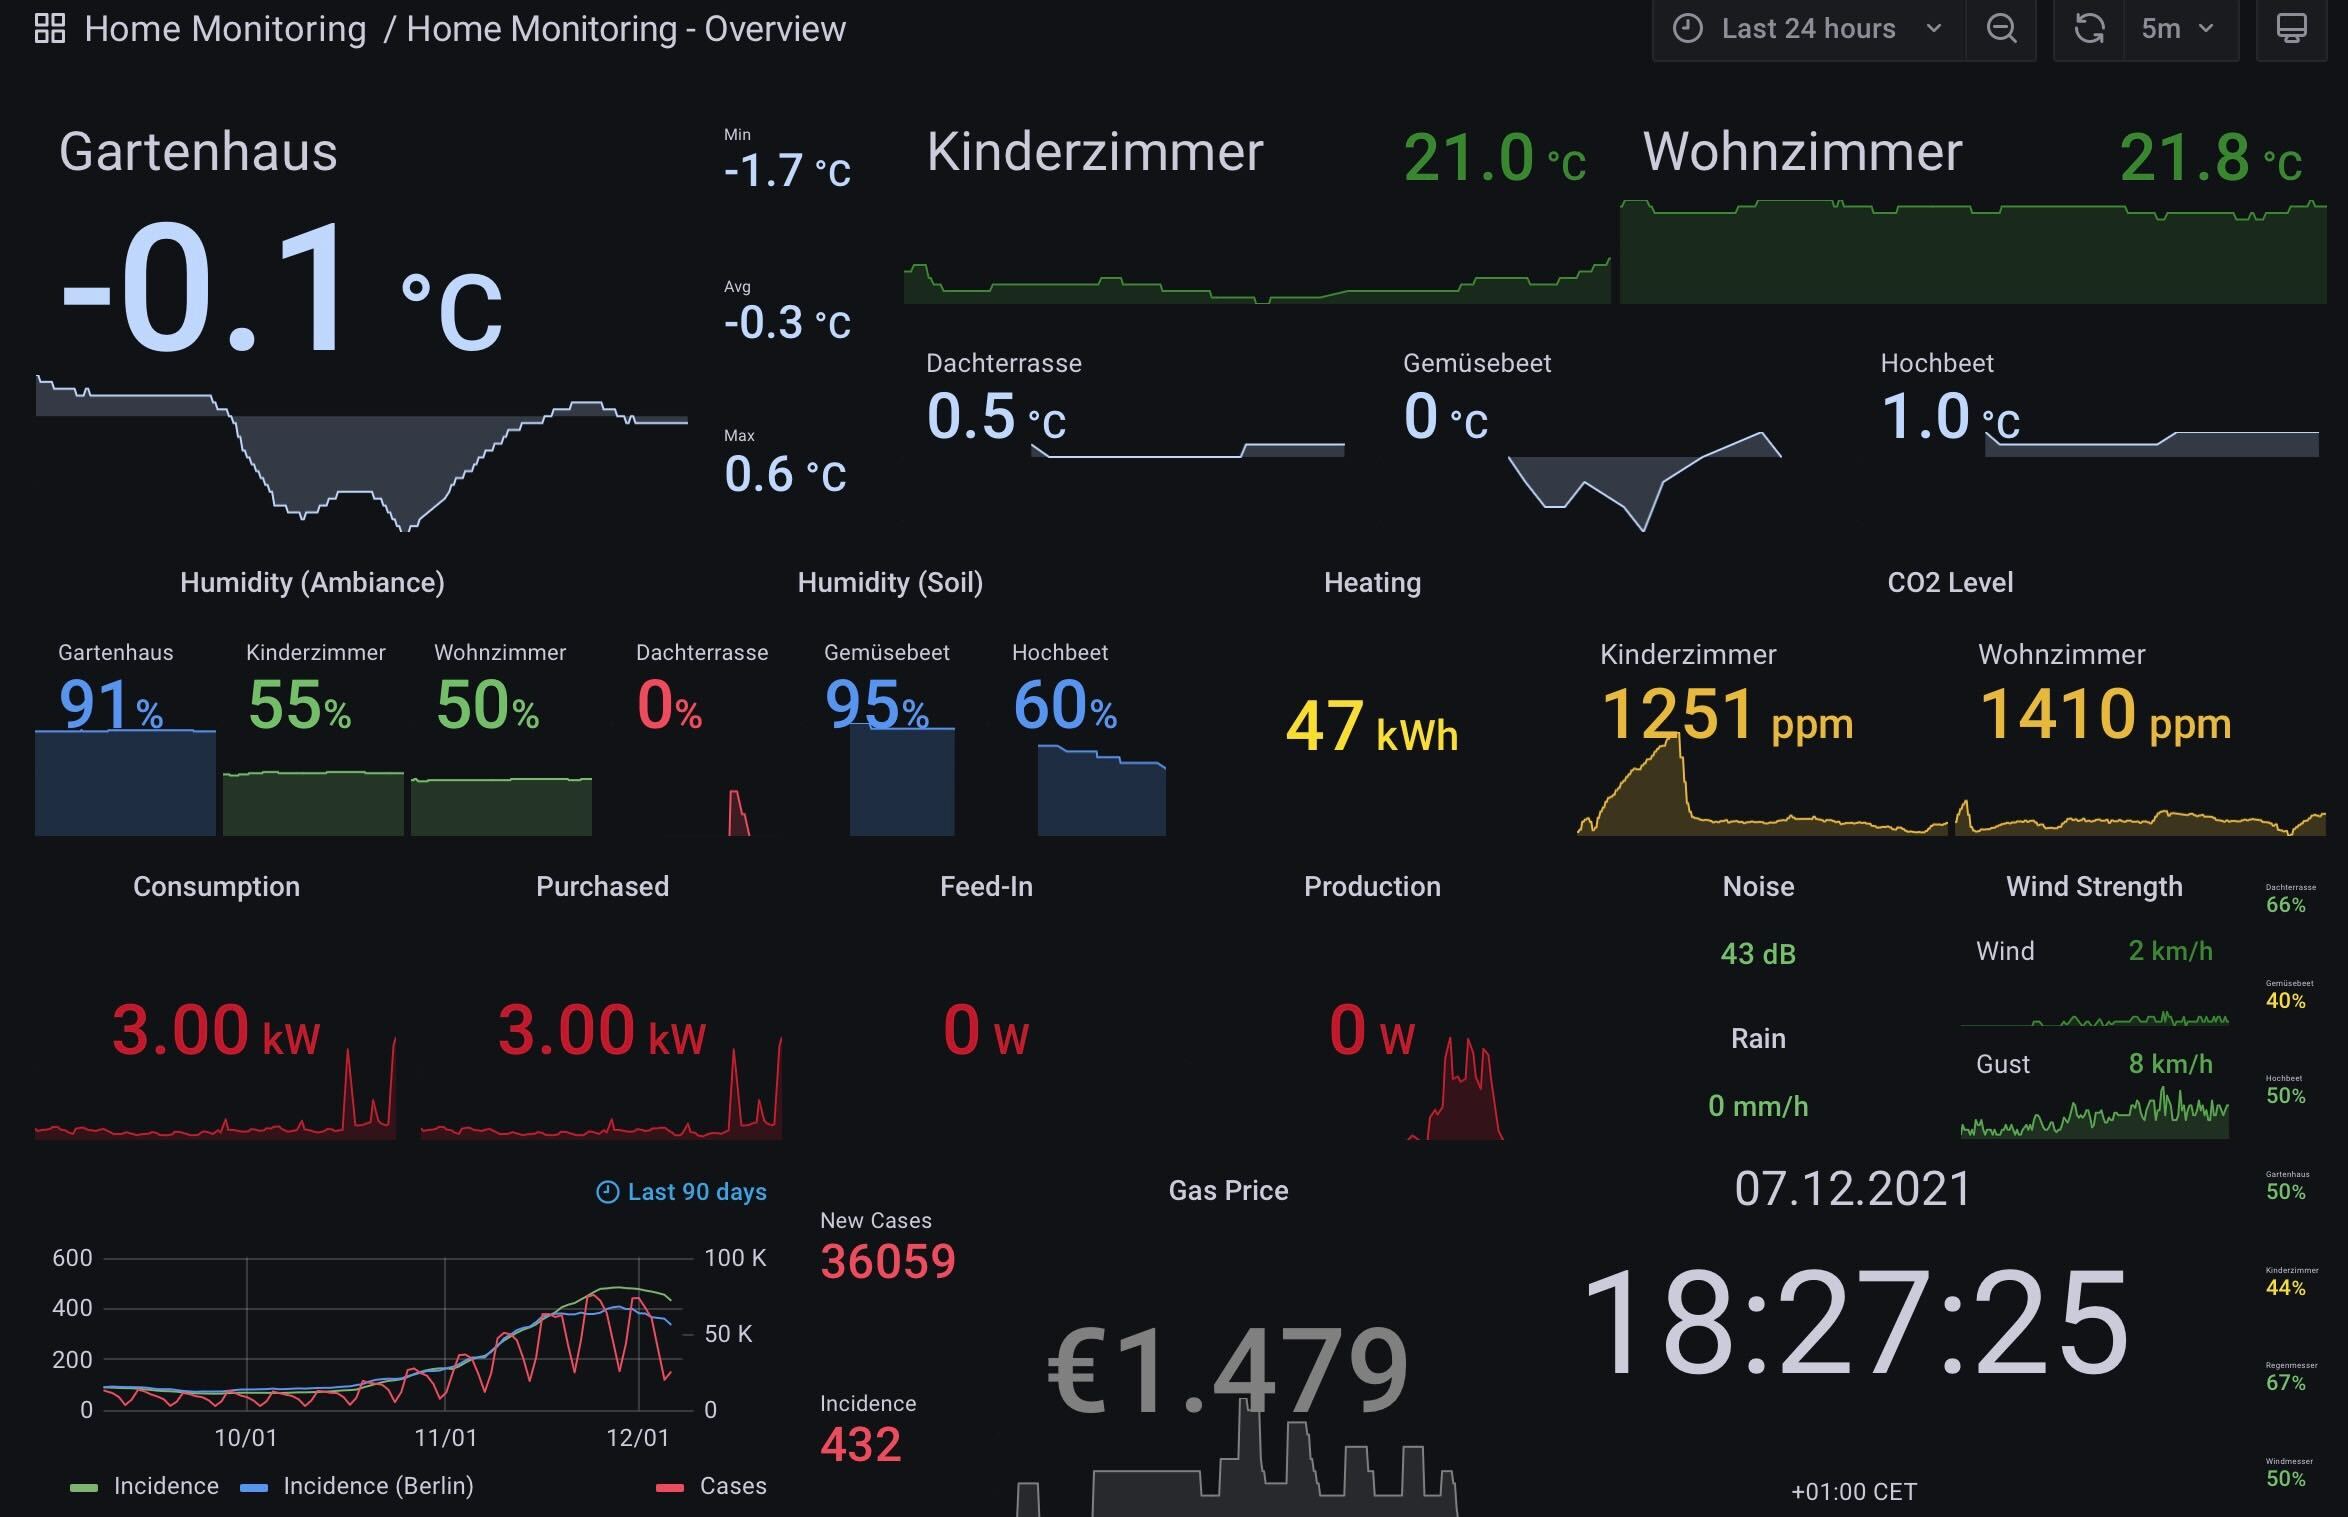
Different smart home application typically come with their own interfaces. As a user I want to have a central place to monitor the central metrics recorded by the different systems.
The project consolidates different scripts and configuration to collect home montitoring metrics on a Raspberry PI 4; we use an influxDB to store and grafana to visualize the measurements.
Systems to Monitor:
- Netatmo is a smart home weather station.
- SolarEdge is a solar inverter and monitoring systems for photovoltaic arrays
- Gardena is a smart gardening system.
- Tankerkoenig provides gas station prices
- Techem Compat V energy meter is monitored via a nanoCUL USB Stick (FTDI CC1101 868MHz FW 1.67 FHEM).
The different components run as docker containers.
Docker volumes can be used by different docker containers to persist data and managed by docker. To create a persistent volume for the influx database, run
docker volume create influxdb-storageTo (download and) start the influxdb container, run
docker run -d \
 --restart unless-stopped \
 -p 8086:8086 \
 --name=influxdb \
 --volume influxdb-storage:/var/lib/influxdb/ \
 influxdb:1.8
to enable the HTTP endpoint on port 8086.
To create a persistent volume for the grafana database and plugins, run
docker volume create grafana-storageTo (download and) start the grafana container, run
docker run -d \
 --restart unless-stopped \
 --net=host \
 --name=grafana \
 --volume grafana-storage:/var/lib/grafana \
 --env "GF_INSTALL_PLUGINS=grafana-clock-panel, grafana-worldmap-panel, pierosavi-imageit-panel, natel-discrete-panel" \
 --env "GF_SECURITY_ALLOW_EMBEDDING=true" \
 --env "GF_AUTH_ANONYMOUS_ENABLED=true" \
 grafana/grafana
The grafana endpoint can be accessed on port 3000 and the login is admin (user name and password). Note that changes to the grafana.ini are set through environment variables in the docker setup (see grafana configuration for details). Specifically,
GF_INSTALL_PLUGINSto install additional pluginsGF_SECURITY_ALLOW_EMBEDDINGandGF_AUTH_ANONYMOUS_ENABLEDto avoid login on tablets and to embed as iframes.
The principal steps including the generation of the SSL Certificate is describe in this blog post. Check the container name and group of the user to set the right permissions of the files (see grafana docker).
To start the grafana container with SSL, run
docker run -d \
 --restart unless-stopped \
 --net=host \
 --name=grafana \
 --env "GF_SERVER_CERT_FILE=/etc/grafana/grafana.crt" \
 --env "GF_SERVER_CERT_KEY=/etc/grafana/grafana.key" \
 --env "GF_SERVER_PROTOCOL=https" \
 --volume $(pwd)/grafana.key:/etc/grafana/grafana.key \
 --volume $(pwd)/grafana.crt:/etc/grafana/grafana.crt \
 --volume grafana-storage:/var/lib/grafana \
 grafana/grafana
Note that additionally to the command on top, we mount the certificate files and set the https configs.
The data collection jobs are scheduled via cron (crontab -e), e.g.,
DYNU_HOST="..."
DYNU_USERNAME="..."
DYNU_PASSWORD="..."

TANKERKOENIG_API_KEY="..."

SOLAREDGE_API_KEY="..."

NETATMO_USERNAME="..."
NETATMO_PASSWORD="..."
NETATMO_CLIENT_ID="..."
NETATMO_CLIENT_SECRET="..."

GARDENA_EMAIL="..."
GARDENA_PASSWORD="..."
GARDENA_APPLICATION_ID="..."
GARDENA_APPLICATION_SECRET="..."

INFLUXDB_HOST="127.0.0.1"
INFLUXDB_PORT=8086
INFLUXDB_USER="..."
INFLUXDB_PASS="..."
INFLUXDB_DB="home_monitoring"


*/5 * * * * /home/pi/src/github.com/BigCrunsh/home-monitoring/homemonitoring/collect_data_tankerkoenig.py --cache-dir /home/pi/logs/station_details > /home/pi/logs/collect_data_tankerkoenig.log 2>&1
*/5 * * * * /home/pi/src/github.com/BigCrunsh/home-monitoring/homemonitoring/collect_data_netatmo.py > /home/pi/logs/collect_data_netatmo.log 2>&1
*/5 * * * * /home/pi/src/github.com/BigCrunsh/home-monitoring/homemonitoring/collect_data_solaredge.py > /home/pi/logs/collect_data_solaredge.log 2>&1
*/30 * * * * /home/pi/src/github.com/BigCrunsh/home-monitoring/deps/gardena/bin/start-gardena-screen.sh > /home/pi/logs/collect_data_gardena.log 2>&1
0 1 * * * /home/pi/src/github.com/BigCrunsh/home-monitoring/homemonitoring/collect_data_techem.py > /home/pi/logs/collect_data_techem.log 2>&1
0 * * * * /home/pi/src/github.com/BigCrunsh/home-monitoring/homemonitoring/update_dns.py > /home/pi/logs/update_dns.log 2>&1