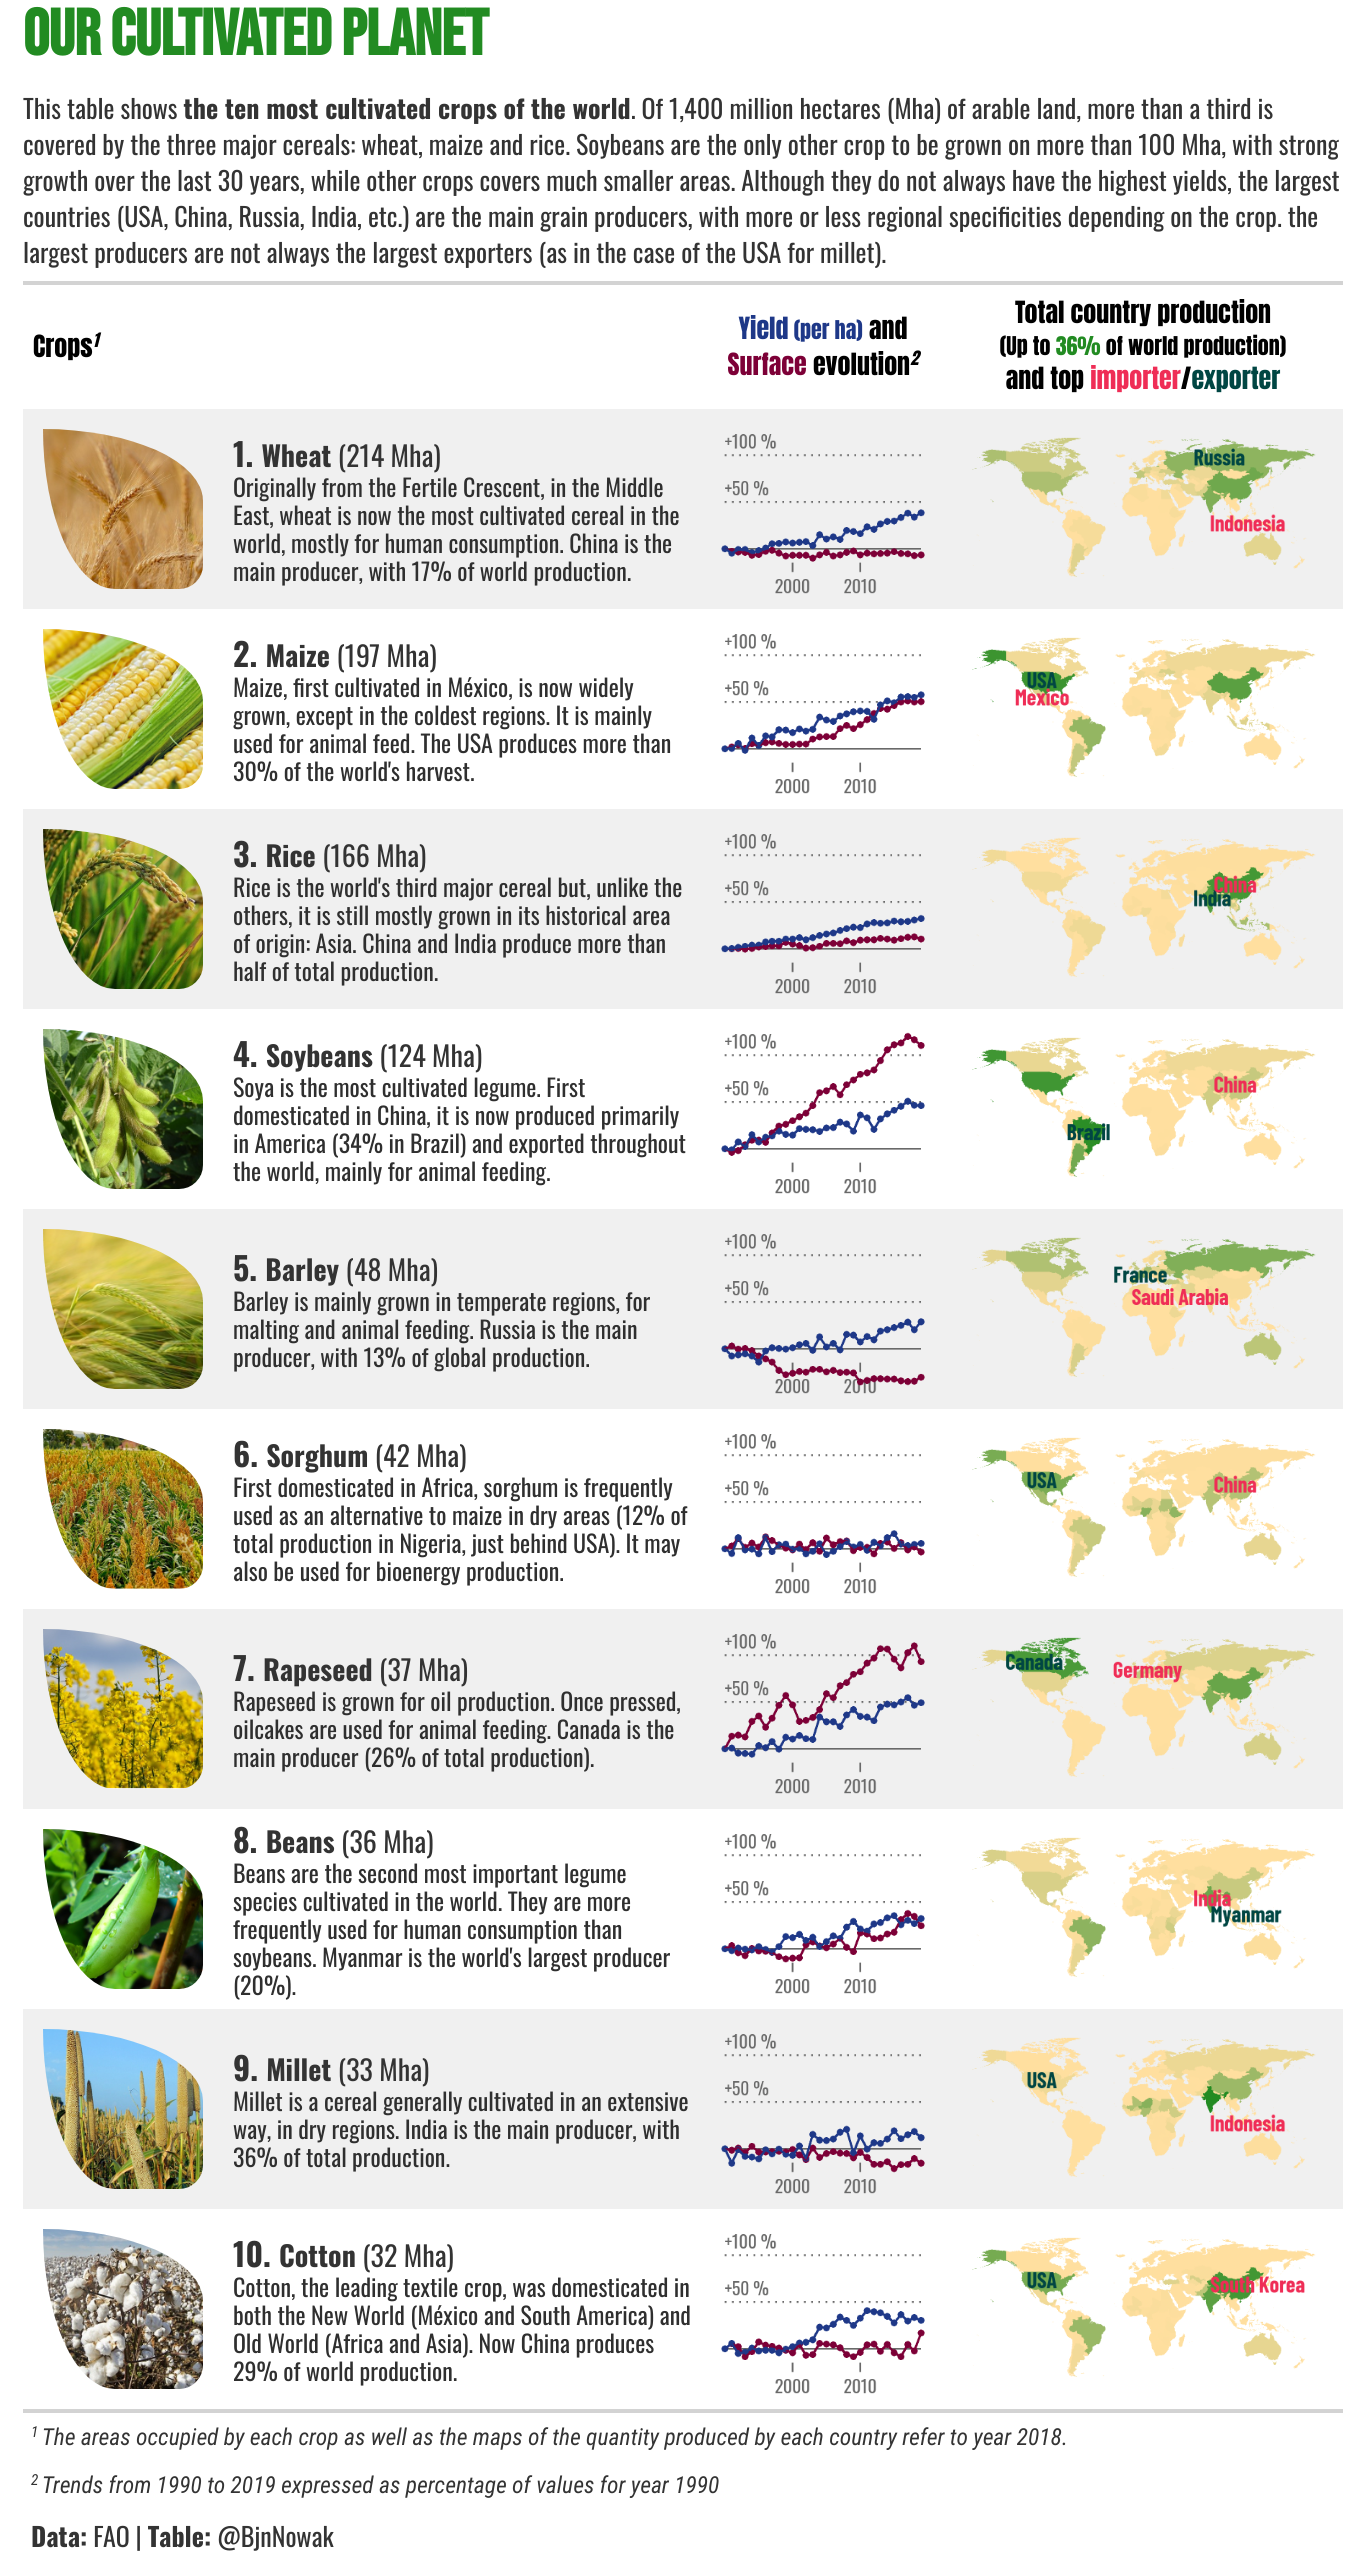
The "One Farm" project is a compilation of two tables (Our Cultivated Planet for crop productions and The Big Barnyard for animal productions) summarizing the main key figures about world farming , based on data from the Food and Agriculture Organization (FAO). The R scripts and data used to create these tables are available in this repository.
There are many ways to compare agricultural productions, such as the number of calories produced, but for this project I wanted to use the simplest metrics, such as the area occupied by each crop or the number of animals of each species.
In order to be easily comparable, both tables share the same structure:
- Species description
- Evolution of production factors over the last 30 years
- Geographical distribution of the productions
Regarding the production factors, as the world's population increases, there are two ways to increase agricultural production: increase the units of production (number of hectares cultivated or number of animals raised) or increase the productivity per unit ( for instance the yield per hectare). For each type of agricultural production, the second column two thus allows to compare the evolution of the number of production units and of the productivity of each unit. To facilitate comparisons between species, these trends are expressed as percentages relative to year 1990 values.
Crop productions (code here)
Animal production (code here)
Each plot or map inside the tables is a ggplot object. Several choices have been made to allow the readability of these illustrations in the tables (minimal x-/y- axis for the plots, no color legend for the maps, etc...). But the functions used to create the illustations can be extracted to create single, more detailed figures, as in the example below.


