I am learning finance under master Ayoub Goudarzi and he told me to start with some small data.
So, what I had inside my mind was to work on tmctse but most of people use it and it has many pre created stuff. I changed my mind and worked on internet usage with VPN.
I created a simple v2ray vpn with x-ui just for my project and give people configs to connect and use that I be able to make some analytics with usage.
Inside project you can see a notebooks and a script. With script we collect data and with notebook we analyze colelcted data. Something like this.
We had notebooks in this project like total and collect that I delete them. We now have a notebook that do everything. Let's review what kind of charts did we have.
So, let's review our charts. I used subplot for this update.
| Treemap | Bar | Pie |
|---|---|---|
 |
 |
 |
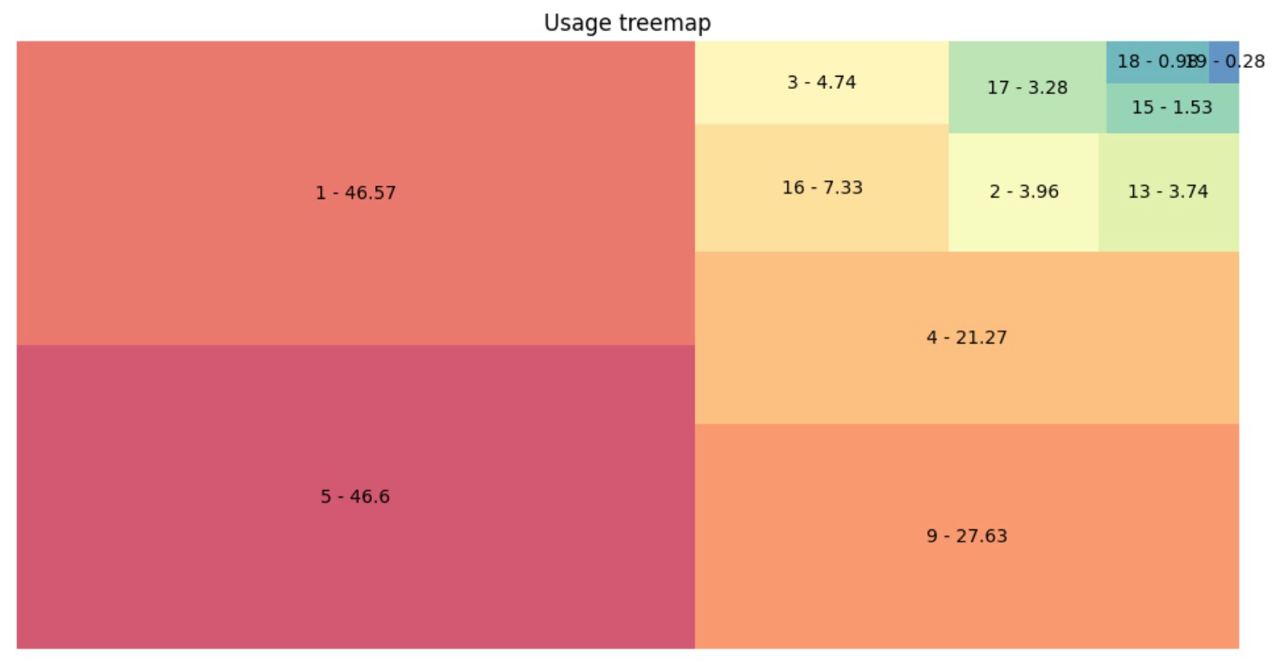
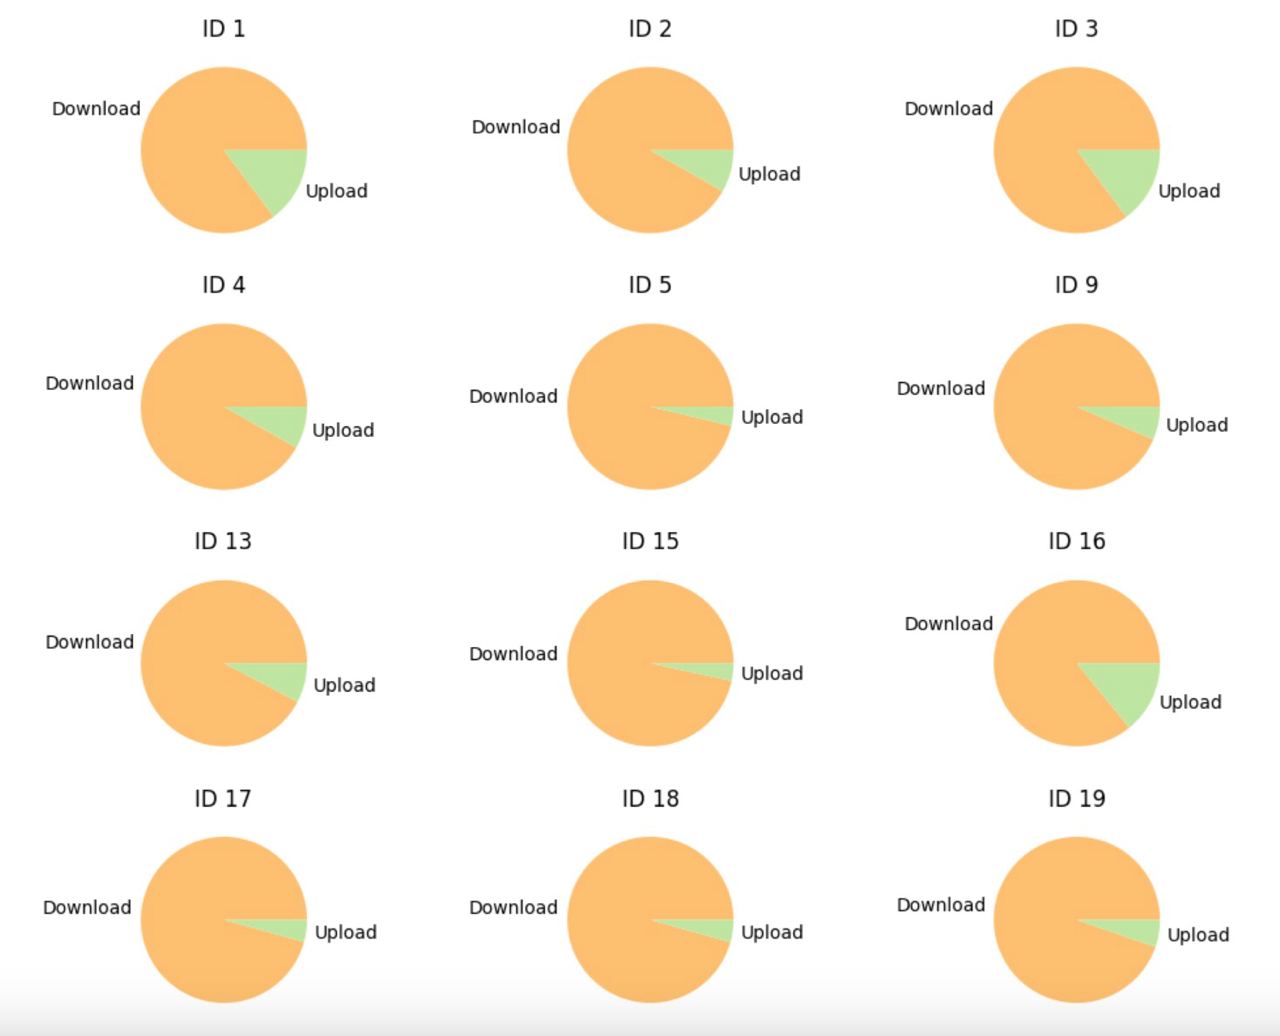
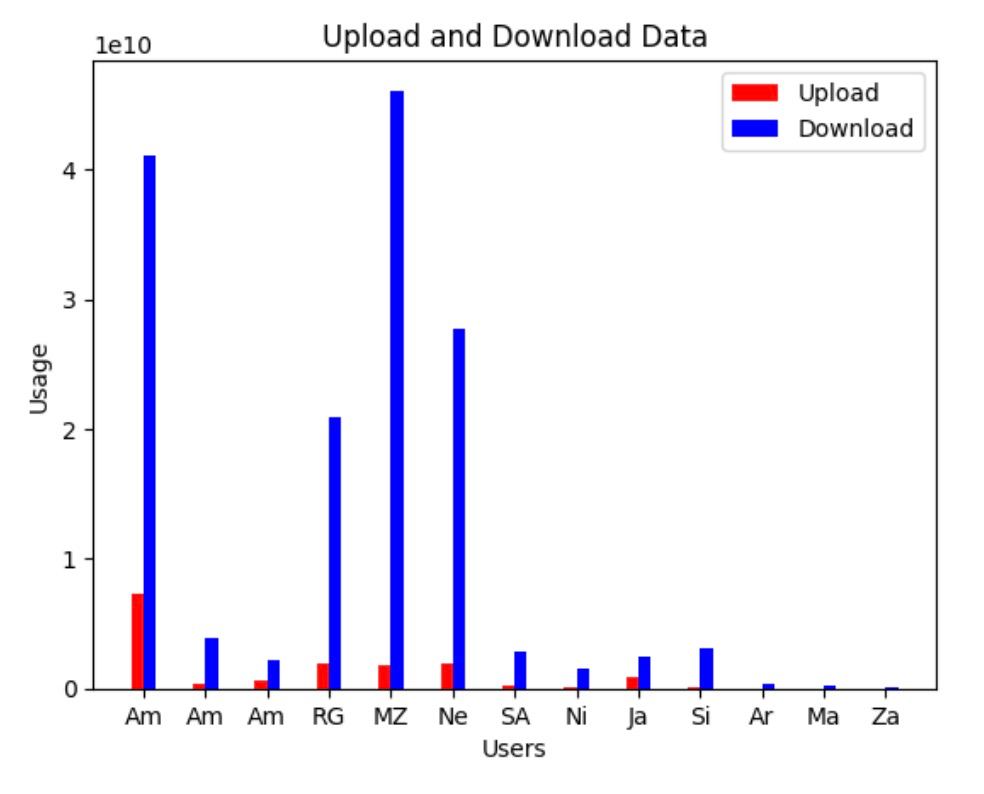
The total notebook was where it collect all data and give you treemap, bar chart and pie chart.
| Treemap | Bar | Pie |
|---|---|---|
 |
 |
 |
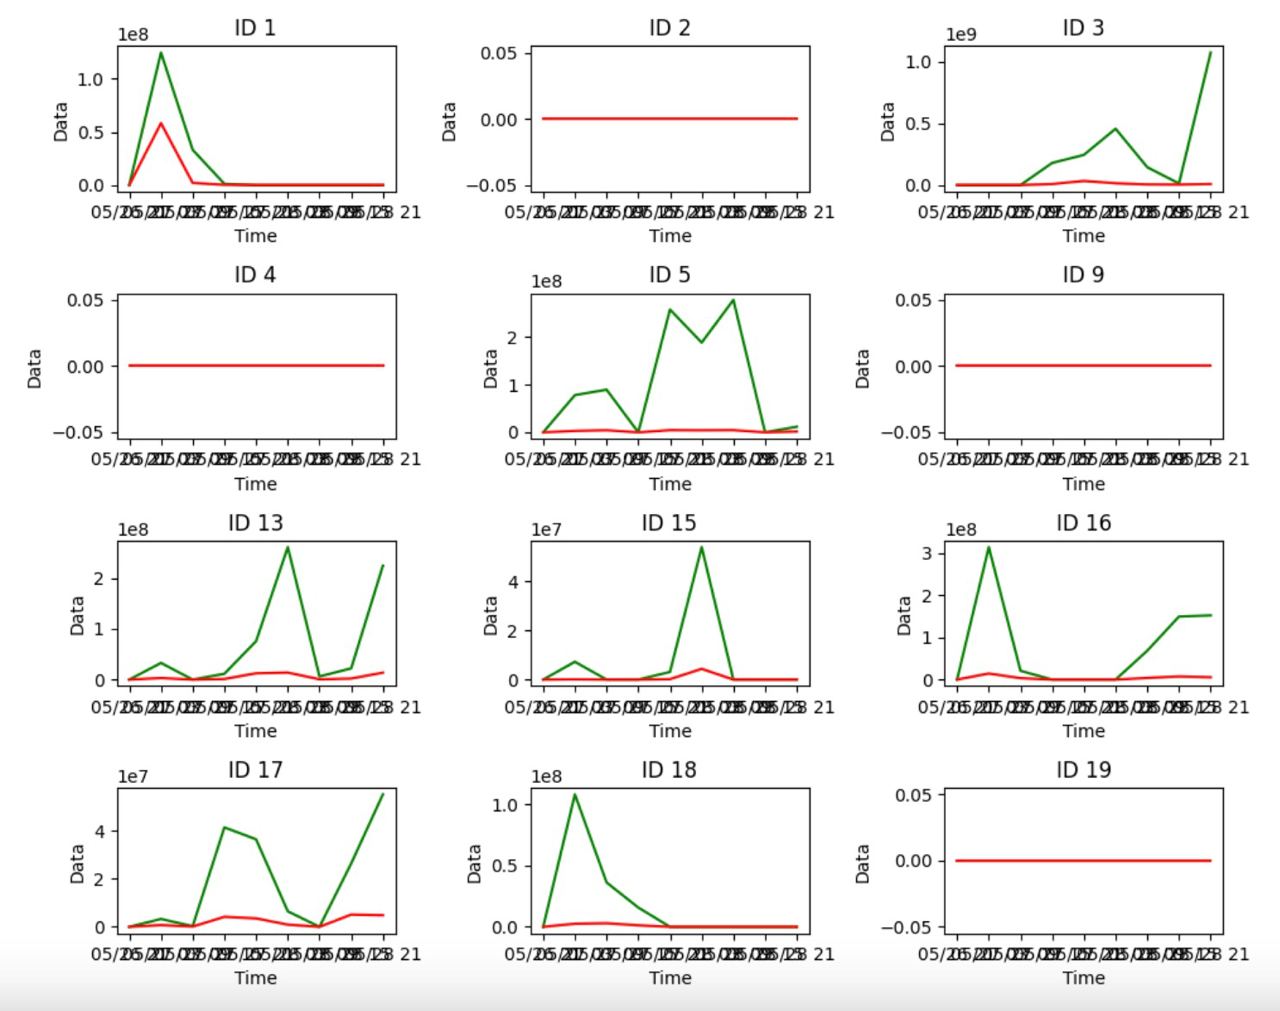
At user notebook we had line chart,and pie chart..
| Bar | Pie |
|---|---|
 |
 |
With with notebook we collect usage and save in database. But we created that notebook in a script that it is placed in a server that runs every 1 hour with crontab.