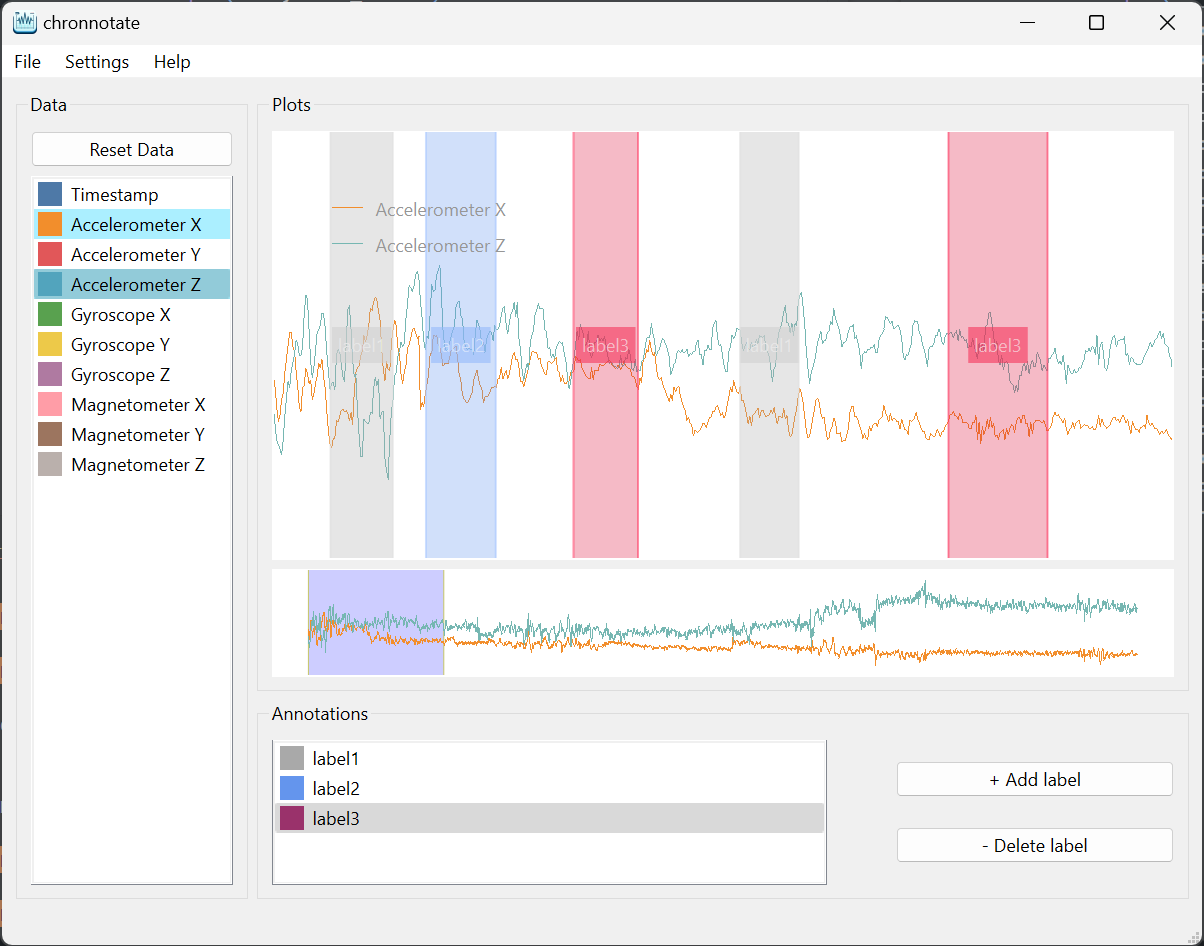
Application for labeling time-series data.
Ensure you have Python 3.11 installed, and preferrably use environment (venv, conda).
- Clone the repo
- Install required dependencies (
[dev]for development tools, like linter and formatter):pip install .[dev] - Launch the app by running
chronnotate.
It is also possible to distribute the app as a single executable, holding all the dependencies.
Such executable can be created with pyinstaller:
pyinstaller src/app.py --name chronnotate --onefile --windowed --icon="ui/resources/icon.ico" --exclude PySide6
- Load CSV file.
- Select the signals that you want to show during labeling from the list on the left side.
- Add labels in the bottom.
- Select label(s) from the list and add them by left mouse click and dragging on the main plot area. Remove by right click on the labels.
The main plot can be scaled by holding the right mouse click and moving in x or y axis direction. Panning is possible by clickin on the third mouse button (mouse-wheel) and dragging in the plot area.
