![]()
This simple tool aims on open-source projects providing simple repository stats which are a bit out of scope of base Git and need some more information about issues and PRs.
- cumulative caching (no need to full download, just incremental/needed update)
- collection of overall user contributions to issues/PRs
- visualization of aggregated timeline of past contributions
Simple install with setuptools/pip as
pip install https://github.com/Borda/pyRepoStats/archive/main.zipor after cloning the repository
python setup.py installLet's show how to pull data from Github repository, use of the following calls
- if you just clone this repo without installation, you need to install dependencies and call script
pip install -r requirements.txt
python src/repo_stats/__main__.py -gh PyTorchLightning/pytorch-lightning-bolts
- if you have already installed the package with
pipor withsetup.pyyou can call executableor package with a pythonic wayrepostat -gh PyTorchLightning/pytorch-lightning-bolts -t <your-personal-token>
just note that with this way usage should also consider passingpython -m repo_stats -gh PyTorchLightning/pytorch-lightning-bolts
-oargument for output path, otherwise all caches and results will be saved in installation folder, most likely site-packages
To simplify the token passing in each call, you can export the token to environment variables export GH_API_TOKEN=<your-personal-token> for Github.
For GitHub users we recommend using your personal GitHub token which significantly increases request limit per hour.
The calls above just pull the data, to get/show some results check available options python -m repo_stats.cli --help
-
To see following summary table use
--users_summary "merged PRs" "commented PRs" "opened issues" "commented issues"where the fist column is used for sorting rows with users:user merged PRs commented PRs opened issues commented issues williamFalcon 74 21 14 8 Borda 42 35 4 18 akihironitta 17 1 5 5 ananyahjha93 14 2 6 21 annikabrundyn 12 0 0 2 djbyrne 11 2 4 4 nateraw 9 1 6 8 teddykoker 3 2 0 0 -
With
--min_contribution Nyou can a simple filter what is the minimal number of contribution to show users in Table or Figures. -
You can also define a time frame with
--date_fromand--date_tofor filtering events - created issues, merged PRs and comments/reviews. -
We also offer showing some contribution aggregation over time such as Day/Week/Month/Year, to do you use option
--user_comments Wwhich draw following double chart: (a) cumulative aggregation over all users and (b) heatmap like image with time in Y and user in X axis. Moreover, you can also specify type such as issue or PR; so with--user_comments W issue pryou can simply get two figures - one with weekly aggregation for issue and another for PRs. The very same way you can specify multiple time sampling--user_comments W Mfor weekly and monthly aggregations.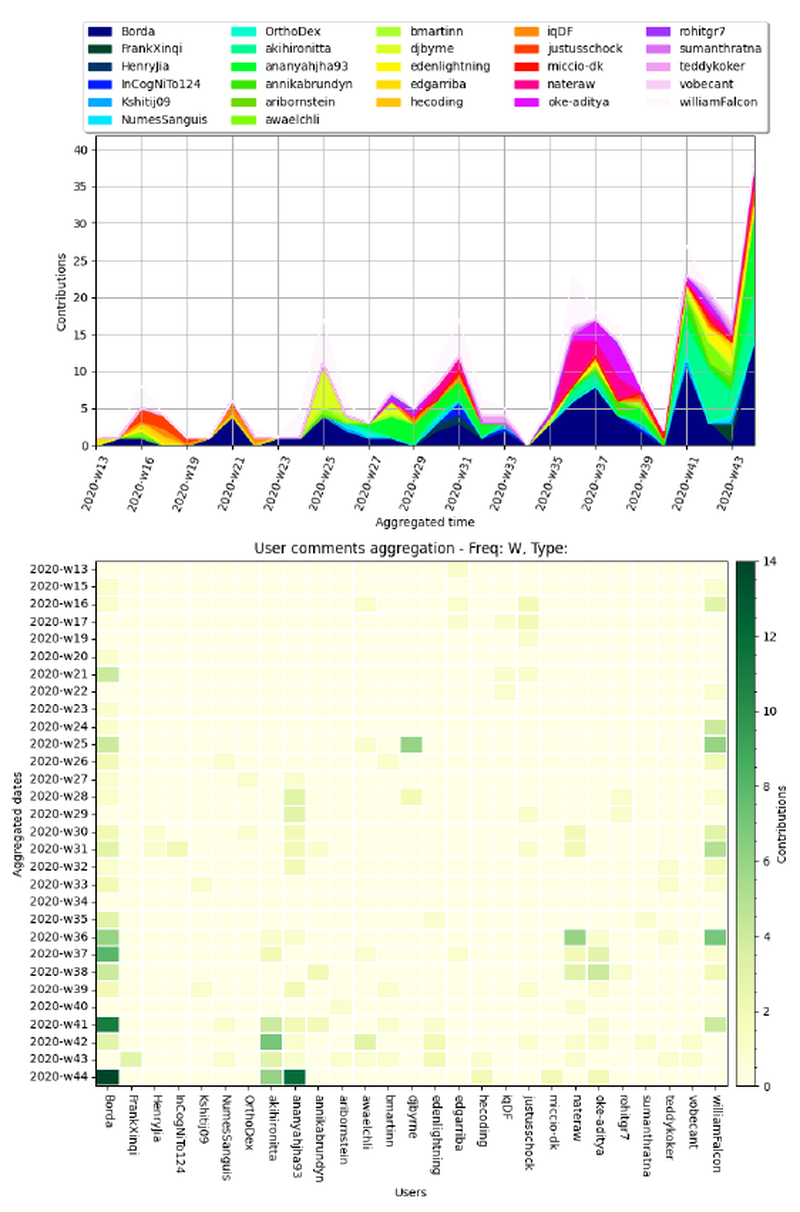

To deny showing figures set environment variable export SHOW_FIGURES=0.
Any help or suggestions are welcome, pls use Issues :]