{tidyverse}: Easily Install and Load the 'Tidyverse'
{lubridate}: Make Dealing with Dates a Little Easier
{stringr}: Simple, Consistent Wrappers for Common String Operations
{janitor}: Simple Tools for Examining and Cleaning Dirty Data
{data.table}: Extension of 'data.frame'
{tidylog}: Logging for 'dplyr' and 'tidyr' Functions
{pointblank}: Data Validation and Organization of Metadata for Local and Remote Tables
{openxlsx}: Read, Write and Edit xlsx Files
{fcuk}: The Ultimate Helper for Clumsy Fingers
{dataCompareR}: Compare Two Data Frames and Summarise the Difference
{httr}: Tools for Working with URLs and HTTP
{textclean}: Text Cleaning Tools
{annotater}: Annotate Package Load Call.
{NbClust}: Determining the Best Number of Clusters in a Data Set
{geodist}: Fast, Dependency-Free Geodesic Distance Calculations
{report}: Automated Reporting of Results and Statistical Models
{numbersBR}: Validate, Compare and Format Identification Numbers from Brazil
{writexl}: Export Data Frames to Excel 'xlsx' Format
{knitr}: A General-Purpose Package for Dynamic Report Generation in R
{gganimate}: A Grammar of Animated Graphics
{cartogram}: Create Cartograms with R
{reactablefmtr}: Streamlined Table Styling and Formatting for Reactable
Like this:
{gt}: Easily Create Presentation-Ready Display Tables
{biscale}: Tools and Palettes for Bivariate Thematic Mapping
{geogrid}: Turn Geospatial Polygons into Regular or Hexagonal Grids
Like this:

{ggchicklet}: Create Chicklet (Rounded Segmented Column) Charts
Like this:

{ggfittext}: Fit Text Inside a Box in 'ggplot2'
{ggdensity}: Interpretable Bivariate Density Visualization with 'ggplot2'
{ggimage}: Use Image in 'ggplot2'
{ggridges}: Ridgeline Plots in 'ggplot2'
Like this:
{ggmap}: Spatial Visualization with ggplot2
{ggtext}: Improved Text Rendering Support for 'ggplot2'
{WeightedTreemaps}: Generate and Plot Voronoi or Sunburst Treemaps from Hierarchical Data
Like this:

{ggplotify}: Convert Plot to 'grob' or 'ggplot' Object
{scales}: Scale Functions for Visualization
{ungeviz}: An R Package for Generating Modular Plots with 'ggplot2’:
{geomtextpath}: Curved Text in 'ggplot2’
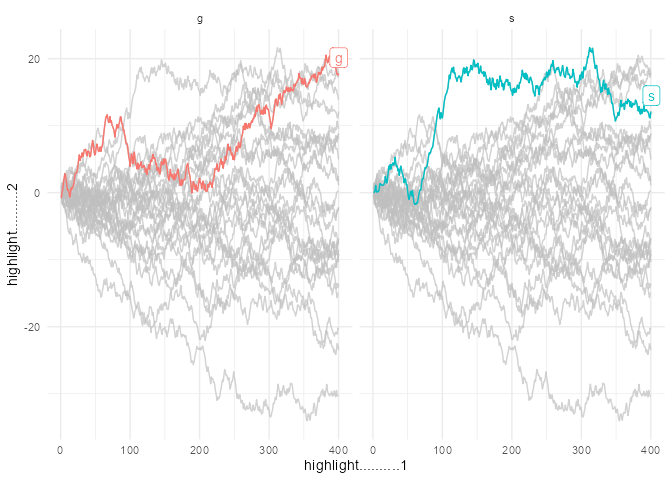
{gghighlight}: Highlight Lines and Points in 'ggplot2’
Like this:
{rayshader}: Create Maps and Visualize Data in 2D and 3D
{ggbump}: Bump Chart and Sigmoid Curves
Like this:

{ggVennDiagram}: A 'ggplot2' Implement of Venn Diagram
{ggvis}: Interactive Grammar of Graphics
{highcharter}: A Wrapper for the 'Highcharts' Library
{lattice}: Trellis Graphics for R
{cartogramR}: Continuous Cartogram
{gtExtra}: Extending 'gt' for Beautiful HTML Tables
{DTA}: Wrapper of the JavaScript Library 'DataTables'
{reactableInteractive}: Data Tables Based on 'React Table'
{roughsf}: Visualize Spatial Data using 'roughjs'
{scattermore}: Scatterplots with More Points
{rasterpic}: Create a Spatial Raster from Plain Images
{ggrastr}: Rasterize Layers for 'ggplot2'
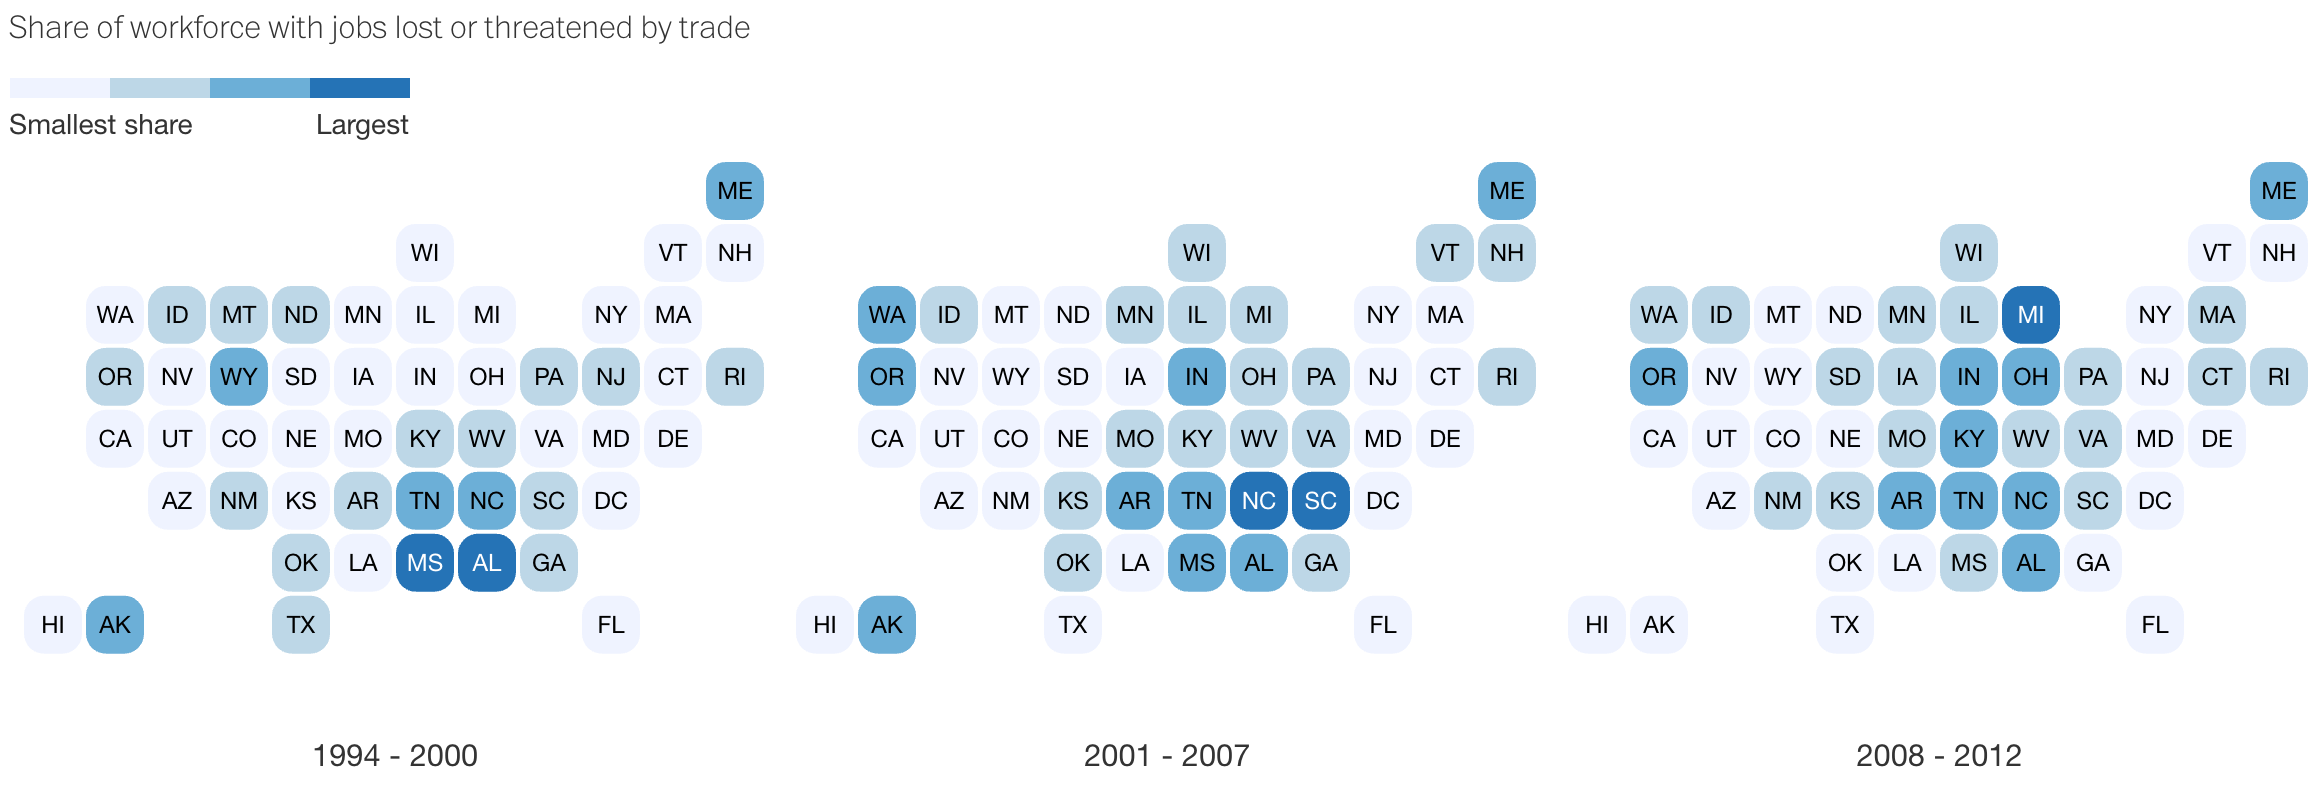
{geofacet}: 'ggplot2' Faceting Utilities for Geographical Data
Like this:
{ggh4x}: Hacks for 'ggplot2'
{apyramid}: Visualize Population Pyramids Aggregated by Age
{bdscale}: Remove Weekends and Holidays from ggplot2 Axes
{calendR}: Ready to Print Monthly and Yearly Calendars Made with 'ggplot2'
{cowplot}: Streamlined Plot Theme and Plot Annotations for 'ggplot2'
{geoviz}: Elevation and GPS Data Visualisation
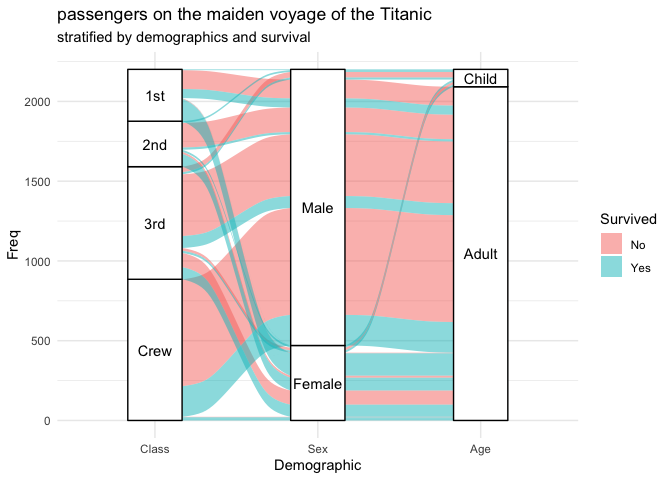
{ggalluvial}: Alluvial Plots in 'ggplot2'
Like this:
{ggcorrplot}: Visualization of a Correlation Matrix using 'ggplot2'
{ggfortify}: Data Visualization Tools for Statistical Analysis Results
{ggfun}: Miscellaneous Functions for 'ggplot2'
{gggibbous}: Moon Charts, a Pie Chart Alternative
{ggHoriPlot}: Horizon Plots for 'ggplot2'
{gglm}: Grammar of Graphics for Linear Model Diagnostic Plots
{gglorenz}: Plotting Lorenz Curve with the Blessing of 'ggplot2'
{ggnormalviolin}: A 'ggplot2' Extension to Make Normal Violin Plots
Like this:

{ggbeeswarm}: A ‘ggplot2’ Extension to Make Beeswarm plots (aka column scatter plots or violin scatter plots)
{ggnetwork}: Geometries to Plot Networks with 'ggplot2'
{ggnewscale}: Multiple Fill and Colour Scales in 'ggplot2'
{ggpage}: Creates Page Layout Visualizations
{ggpattern}: 'ggplot2' Pattern Geoms
{ggpointdensity}: A Cross Between a 2D Density Plot and a Scatter Plot
Like this:

{ggpointless}: A Small Collection of Geometries, and Stats for 'ggplot2'
{ggside}: Side Grammar Graphics
{ggTimeSeries}: Time Series Visualisations Using the Grammar of Graphics
{ggtrace}: Trace and Highlight Groups of Data Points
Like this:

{plot3Drgl}: Plotting Multi-Dimensional Data - Using 'rgl'
{ggpattern}: provides ggplot2 helms which support filled areas with geometric and image-based patterns.
{ggiraph}: tool that allows you to create dynamic ggplot graphs.
{PerformanceAnalytics}: Econometric Tools for Performance and Risk Analysis
{zoo}: S3 Infrastructure for Regular and Irregular Time Series (Z's Ordered Observations)
{AER}: Applied Econometrics with R
{ivreg}: Instrumental-Variables Regression by '2SLS', '2SM', or '2SMM', with Diagnostics
{pder}: Panel Data Econometrics with R
{broom}: summarizes key information about models in tidy tibble()s
{plm}: deal with panel data
{geobr}: Download Official Spatial Data Sets of Brazil
{brpop}: Brazilian Population Estimatives
{GetBCBData}: Imports Datasets from BCB (Central Bank of Brazil) using Its Official AP
{covid19br}: Brazilian COVID-19 Pandemic Data
{rsiconfi}: API for Brazilian fiscal data
{brazilianbanks}: Download publicly-available data on Brazilian banks
{GetDFPData}: Reading Annual Financial Reports from Bovespa's DFP, FRE and FCA System
{GetTDData}: Get Data for Brazilian Bonds (Tesouro Direto)
{GetLattesData}: Reading Bibliometric Data from Lattes Platform
{BrazilMet}: Download and Processing of Automatic Weather Stations (AWS) Data of INMET-Brazil
{cropDemand}: Spatial Crop Water Demand for Brazil
{febr}: Data Repository of the Brazilian Soil
{flightsbr}: Download Flight and Airport Data from Brazil
{electionsBR}: R Functions to Download and Clean Brazilian Electoral Data
{owdbr}: Open Welfare Data Brazil
{microdatasus}: Download Brazilian National Health System (SUS) Data
{owidR}: Import Data from Our World in Data
{WDI}: World Development Indicators and Other World Bank Data
{tidycensus}: Load US Census Boundary and Attribute Data as 'tidyverse' and 'sf'-Ready Data Frames
{bea.R}: Bureau of Economic Analysis API
{usdata}: Data on the States and Counties of the United States
{albersusa}: Tools, Shapefiles & Data to Work with an ‘AlbersUSA’ Composite Projection
{usmap}: US Maps Including Alaska and Hawaii
{getpublist}: Obtain a List of Publications from 'PubMed' and 'Google Scholar'
{openSkies}: Retrieval, Analysis and Visualization of Air Traffic Data
{elections}: USA Presidential Elections Data
{whereport}: Geolocalization of IATA Codes
{wpp2019}: World Population Prospects 2019
{yahoofinancer}: Fetch Data from Yahoo Finance API
{acdcR}: Agro-Climatic Data by County
{quantmod}: Quantitative Financial Modelling Framework
{googleAnalyticsR}: Google Analytics API into R
{inegiR}: Integrate INEGI’s (Mexican Stats Office) API with R
{rstatscn}: R Interface for China National Data
{crypto2}: Download Crypto Currency Data from 'CoinMarketCap' without 'API'
{eia}: API Wrapper for 'US Energy Information Administration' Open Data
{eurodata}: Fast and Easy Eurostat Data Import and Search
{FAOSTAT}: Download Data from the FAOSTAT Database
{pwt10}: Penn World Table (Version 10.x)
{pipr}: Compute poverty and inequality indicators for more than 160 countries and regions from the World Bank’s database of household surveys