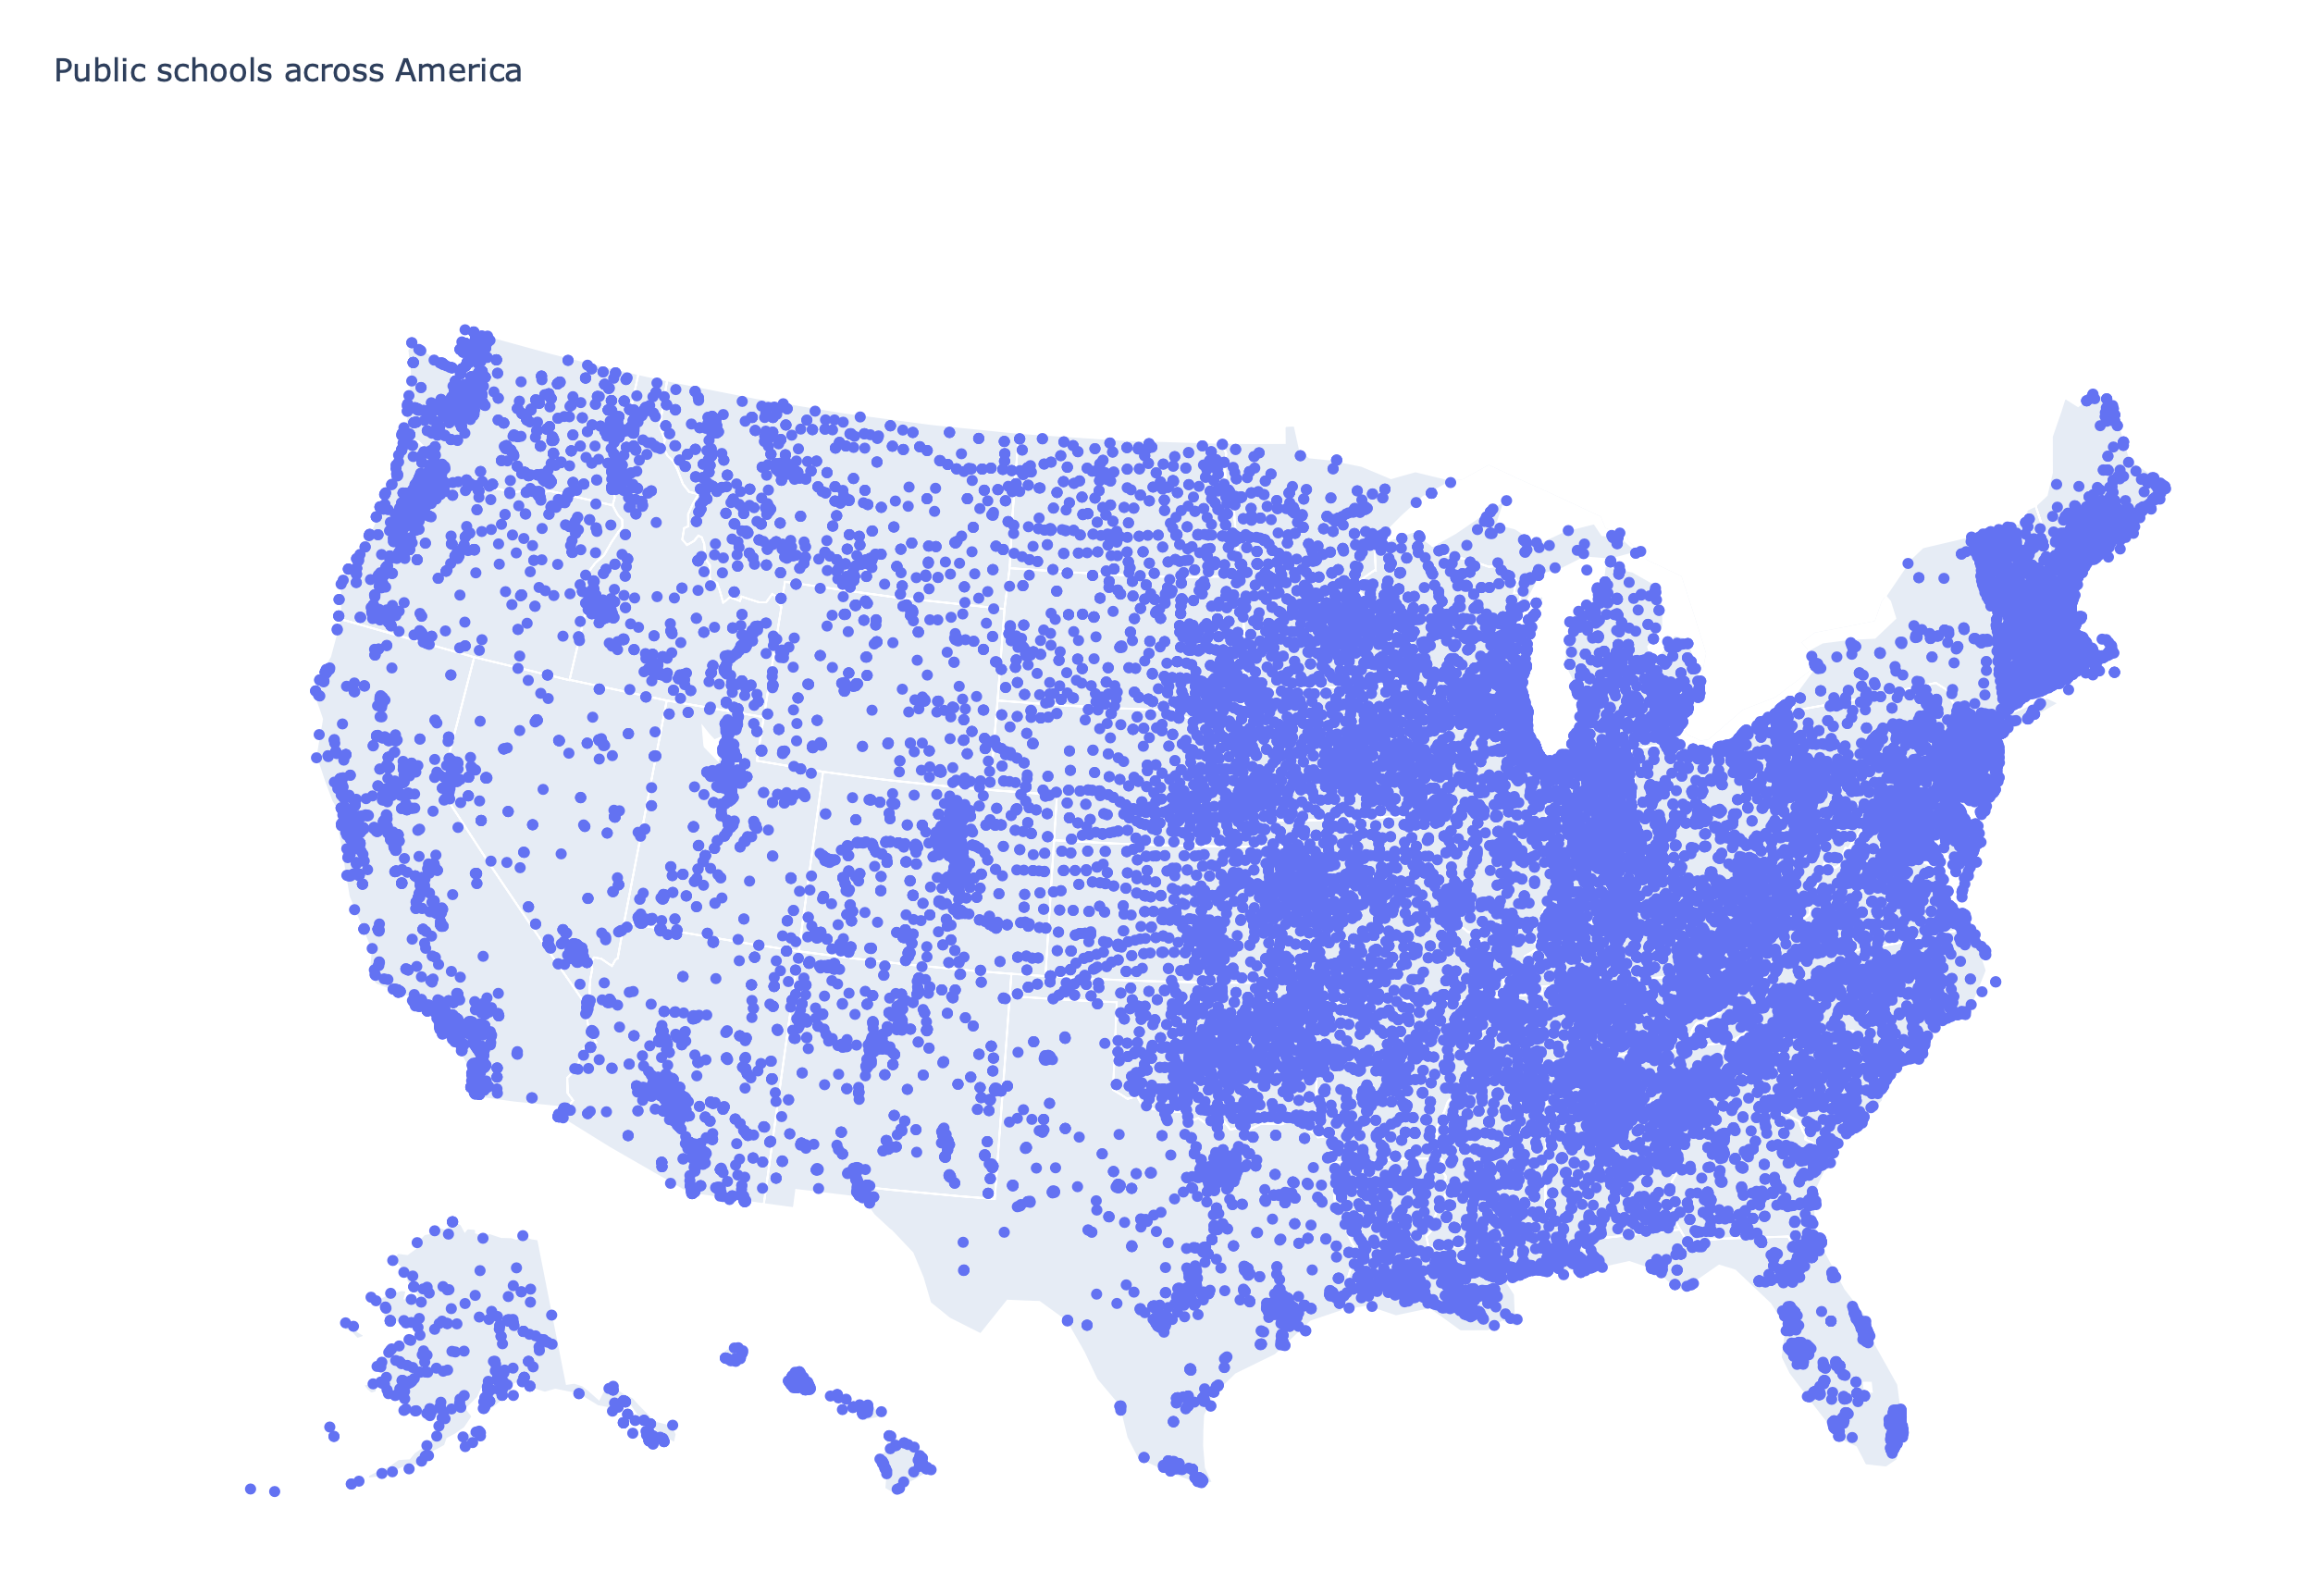
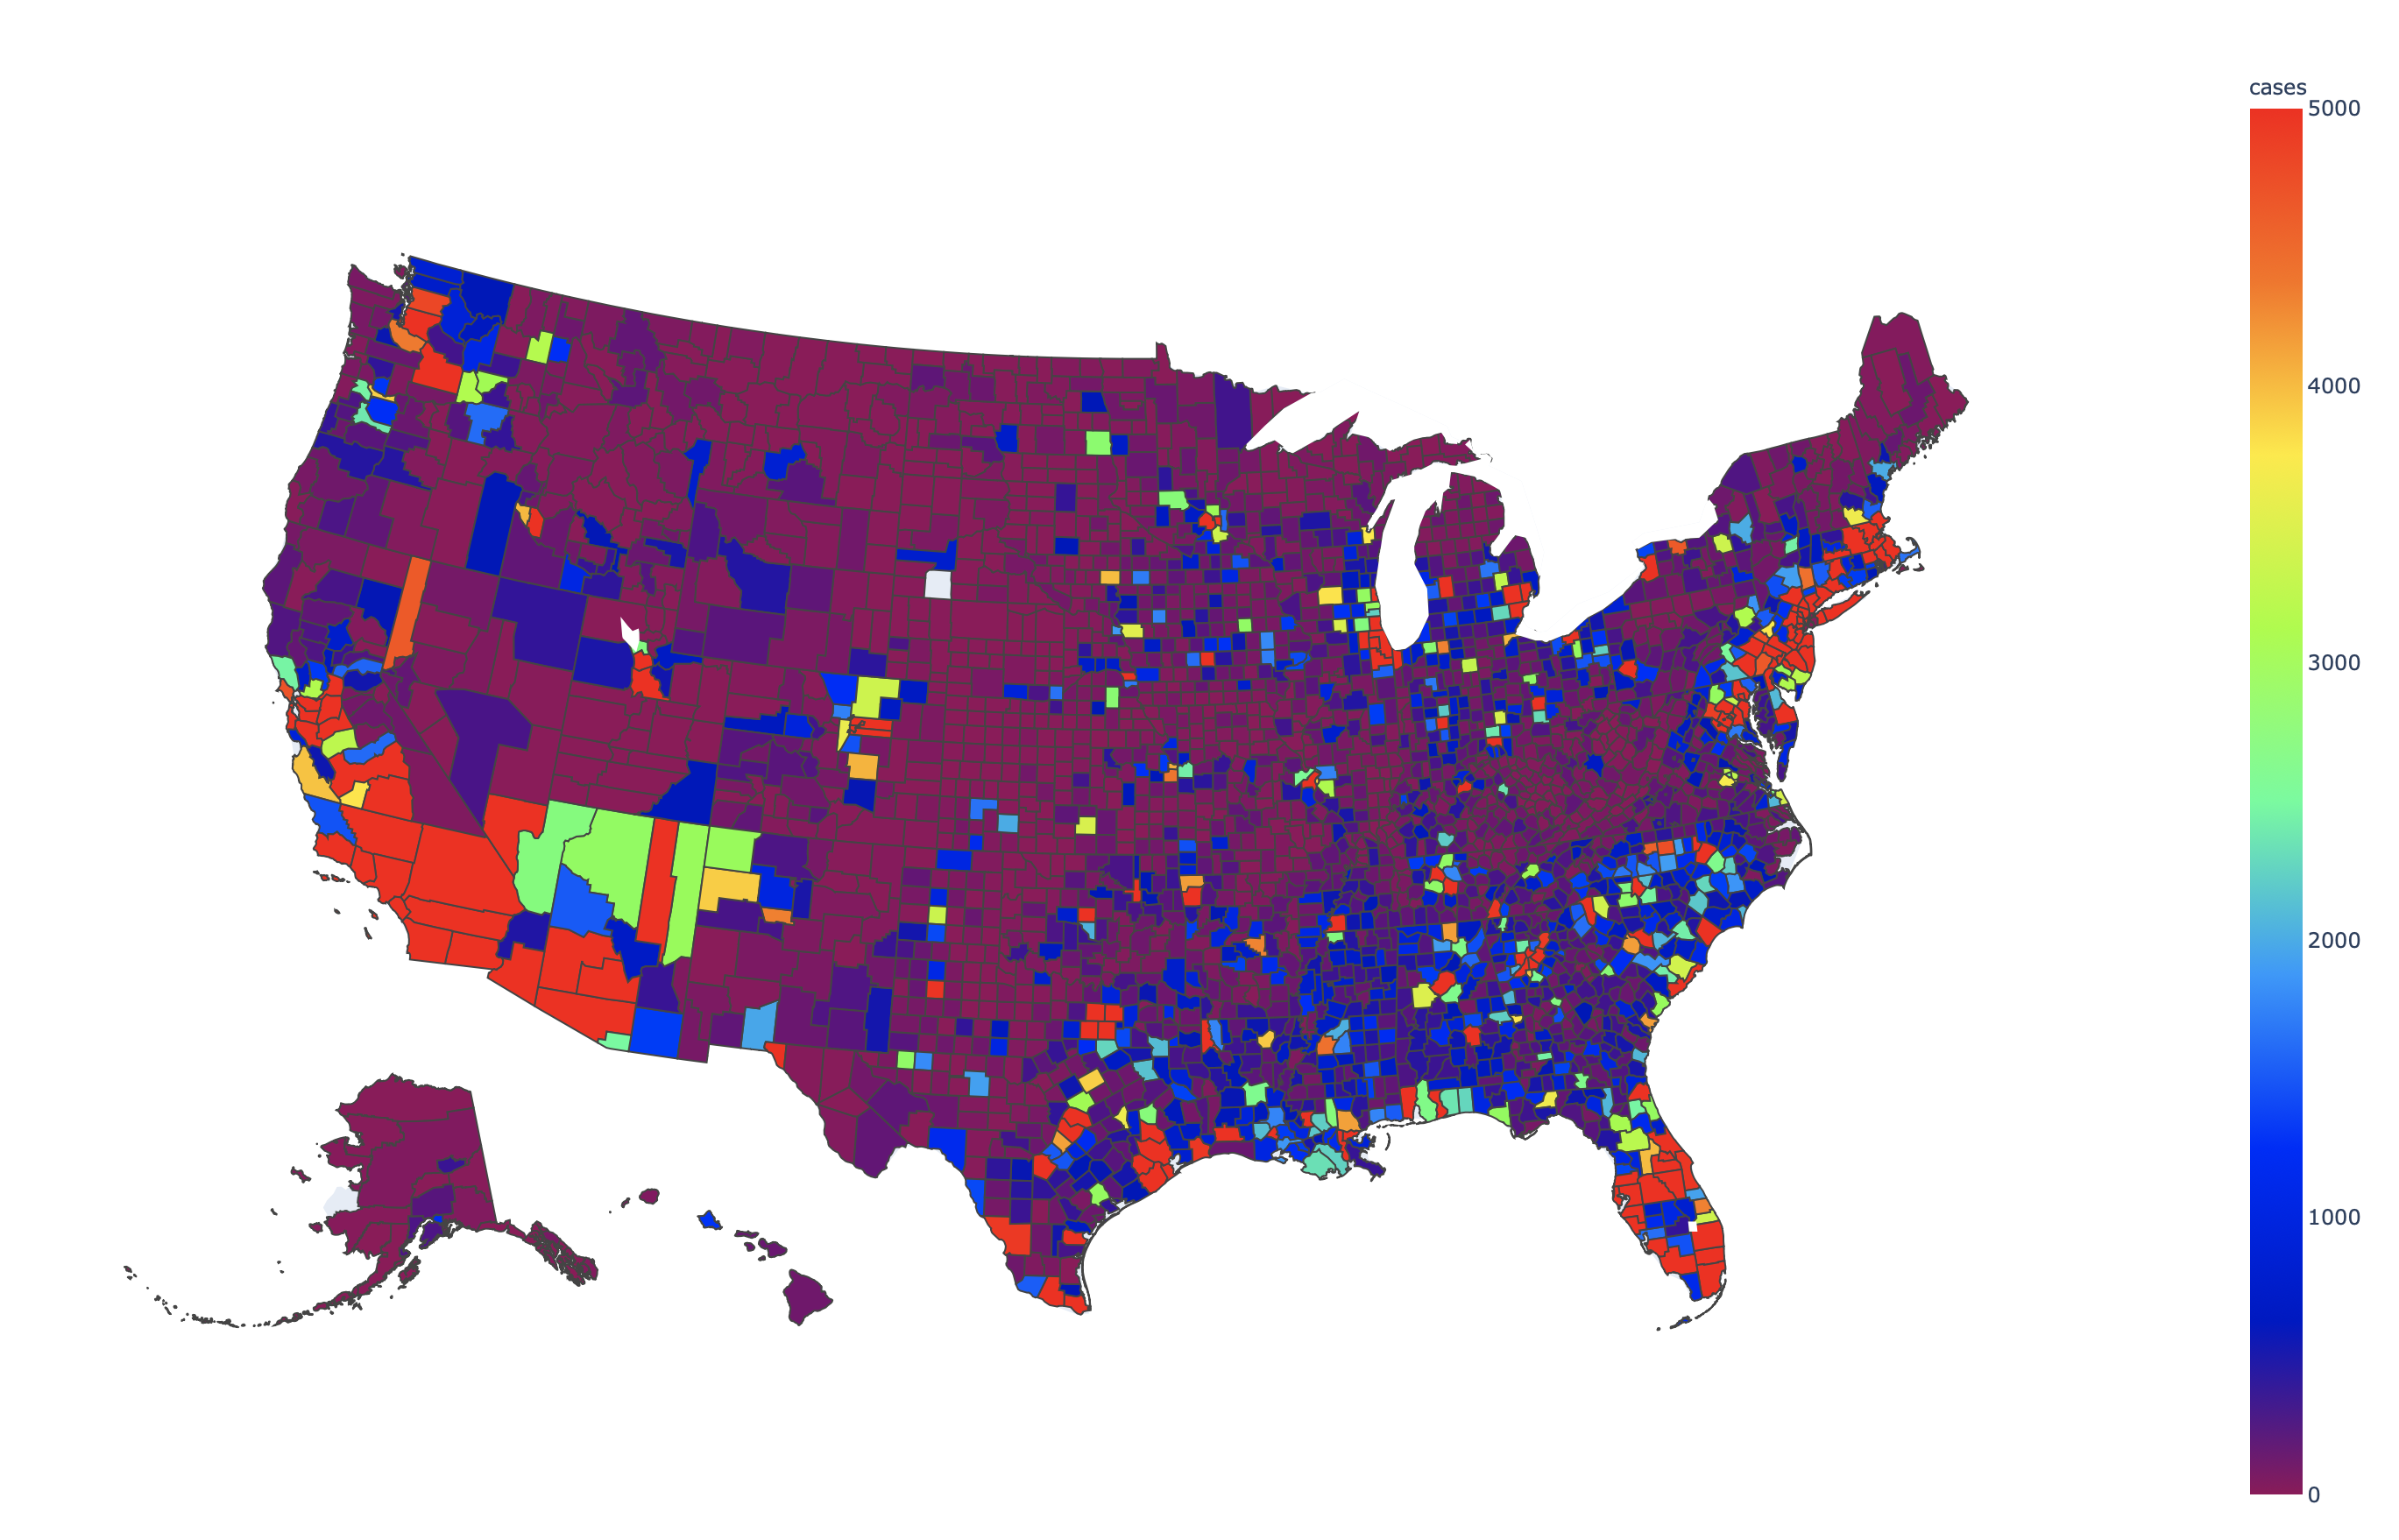
This project was written for a Hackathon hosted by Science Gateways Community Institute to show parents the correlation between public schools and covid cases.
Nia Black
Christian Thomas
Gabrielle Toutin
Chase Busacker
Mentors:
Brandi Kuritz
Rich Asay
We used APIs to get data from the schools and from the covid reporting. The following APIs were used:
kaggle
arcgis.com
And the code uses plotly, dash, pandas to create a webpage that shows the following graphs:


A slider was also implemented to look back in time at cases for each county in the past up to 30 days.
- Either fork or clone this repo to your own machine
- Install Pip for python
- In a terminal/command line, run the following scripts:
"pip install json"
"pip install datetime"
"pip install request"
"pip install dash==1.14.0"
"pip install plotly==4.9.0"
"pip install kaggle" - Run "python3 ./getdata.py" in the cloned repo