Welcome to the project for the 30 Days ML Challenge. In this project, we will be working on a classification model to predict the type of conversation a user is having with the "Break Into Data" Discord server. We will use synthetic conversation data generated by an LLM to train the model and evaluate its performance. The project will also include a front-end application to visualize the generated conversation data and the model's predictions.
The goal is to use this to better understand the Discord server and its users, and to identify patterns and trends in the conversations. This can help in improving the server's content and user experience, as well as identifying potential areas for improvement.
- Dependencies
- Setup
- Data Generation
- Data Cleaning
- Data Transformation
- Model Architecture
- Model Training
- Model Evaluation
- Model Deployment
- Presentation
- Python 3.7+
- LangChain
- Bentoml
- Streamlit
- Clone the repository:
git clone https://github.com/break-into-data/30_days_ml_project.git - Install dependencies:
pip install -r requirements.txt - Set up environment variables (e.g., API keys for language models)
- Run the script:
cd dataset && python generate_dataset.py(if you want to generate the synthetic conversations or use the existingdataset/data/conversations.csvfile) - Run the
model/create_model.ipynbnotebook. - Run the Bentoml service:
cd deployment/ bentoml serve bento_service:TensorFlowClassifierService - Run the Streamlit app:
cd frontend/
streamlit run streamlit_app.py
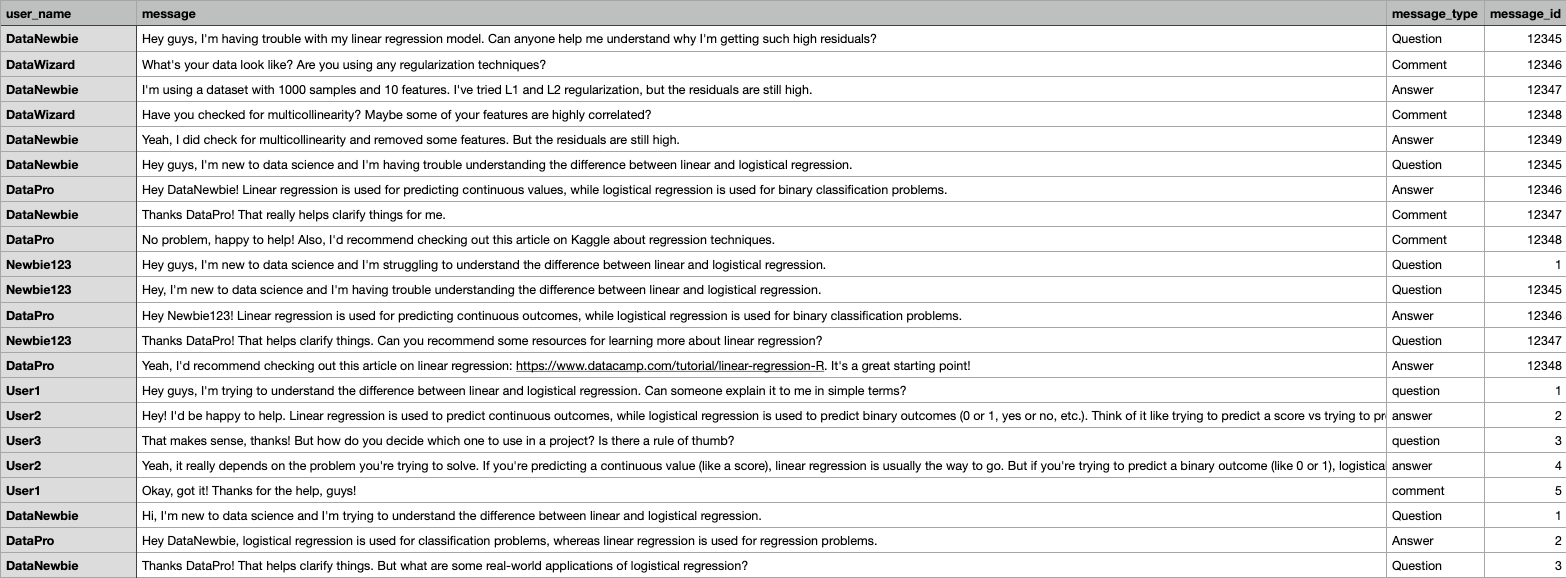
This section explains the process of generating synthetic conversation data to train a classification model for the "Break Into Data" Discord server. Using the dataset/generate_dataset.py script, synthetic conversations are generated based on a prompt describing the Discord server's purpose, channels, and typical conversation topics. We use the LangChain library to interface with various language models (Groq, Anthropic, or Google Generative AI) and generate structured conversation data.
- Tool Used: LangChain, LLMs (e.g., Groq, Anthropic, or Google Generative AI)
- Data Structure: Conversations are outputted as a CSV file (
dataset/data/conversations.csv), consisting of user names, message content, message type (e.g., question, answer, comment), and unique message IDs. - Execution: To generate synthetic conversations, run:
cd dataset/
python generate_dataset.py
Once the conversations data is generated, the data (dataset/data/conversations.csv) is loaded and cleaned to ensure it is in a usable format for the classification model. The following steps are performed:
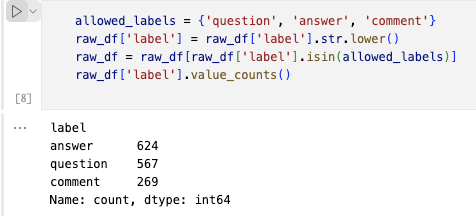
- Select the relevant columns. Here the columns named
messageandmessage_typeis used, which are then renamed totextandlabelfor clarity and consistency. - To focus on relevant data, a predefined set of allowed labels
(question, answer, comment)is established. The lables are first converted to lowercase to standardize the data format, and then filtered to only include the allowed labels.
- Tool Used: Pandas
- Execution: currently done in the
model/create_model.ipynbnotebook.
Text data must be transformed into a numerical format that can be processed by machine learning models. This can be done using techniques such as tokenization, vectorization, and feature extraction. In this project, embeddings are generated using the text-embedding-3-large model by OpenAI, converting text into high-dimensional vectors. This transformation is crucial for capturing the semantic meaning of the text, which enhances model performance.
After the text is transdormed into vectors, the dataset is split into training and testing sets to ensure the model is evaluated on unseen data, preventing overfitting and ensuring generalizability.
- Tool Used: OpenAI, Numpy
- Data Structure: The output vectors are stored in a NumPy array format and saved as
(dataset/data/vectors.npy), ensuring they are ready for efficient loading during the model training phase. - Execution: currently done in the
model/create_model.ipynbnotebook.
The model utilizes a standard neural network architecture suitable for classification tasks. It includes:
-
Input Layer: Designed to accept the pre-processed text data in the form of vectors. The size of these vectors is determined by
embedding_size, which matches the dimensionality of the text embeddings used. -
Hidden Layers: There is one dense layer in the model. This layer uses the ReLU activation function to introduce non-linearity into the model, which helps in learning complex patterns in the data. The number of units in this dense layer equals
embedding_sizehere as well, which means that each unit can learn from every dimension of the input vector. -
Output Layer: A softmax activation function is used on the final layer to output probabilities across the three classes (questions, answers, comments). The output layer has a size of
3as there are three classes. A softmax function is used for multi-class classification tasks, as it normalizes the output probabilities to sum to one, representing probabilities across the classes.
- Tool Used: Keras, TensorFlow, Numpy
- Execution: currently done in the
model/create_model.ipynbnotebook.
The model is set to train for up to 40 epochs with a batch size of 32 and uses the below training configurations:
-
Loss Function: The model uses sparse categorical crossentropy as the loss function. Sparse categorical crossentropy expects labels as integers, while categorical crossentropy would require one-hot encoded vectors. This choice is good for multi-class classification tasks where it compares the model's predicted probability distribution over the classes with the actual distribution, which is a one-hot encoded vector internally converted from an integer label.
Note: Using sparse categorical crossentropy simplifies working with categorical data as it eliminates the need for manually one-hot encoding the labels, reducing memory usage and computational cost. This efficiency can be particularly beneficial when dealing with large datasets or many class labels.
-
Optimizer: An Adam optimizer with a learning rate of 0.001 is used, which is a common choice for many types of neural networks due to its efficiency in handling sparse gradients and adapting the learning rate during training.
-
Metrics: Accuracy is used as the metric for evaluating the model performance during training and testing.
-
Callbacks: A callback for early stopping is used to monitor the training accuracy. If the accuracy does not improve for three consecutive epochs (
patience=3), the training process will stop so that the model does not overfit the data. -
Class Weights: The weights are calculated as the inverse of class frequencies, ensuring that the model does not become biased toward the more common classes. If a class has a higher weight, the model's loss will increase more if it misclassifies an instance from that class, compared to a class with a lower weight. This adjustment compels the model to pay more attention to classes with fewer samples, aiming to correct the bias towards more frequent classes.
- Tool Used: Keras, TensorFlow, Numpy
- Execution: currently done in the
model/create_model.ipynbnotebook.
The model is evaluated using the following metrics:
- Statistical Metrics: Accuracy, recall, and F1 score are calculated to assess the model's performance on the test set. The weighted F1 score is computed to evaluate the model's accuracy while considering label imbalance. It balances the precision and recall of the prediction. Accuracy measures the proportion of total correct predictions (both true positives and true negatives) and recall measures the proportion of true positive predictions out of all positive predictions.
F1 Score: 92.37%
Accuracy: 92.47%
Recall: 92.47%
These metrics indicate that the model performs well across all classes. The similar values suggest that the model is consistent in its predictions across different types of evaluation metrics, which is ideal for a balanced dataset or one where class weights effectively manage imbalance.
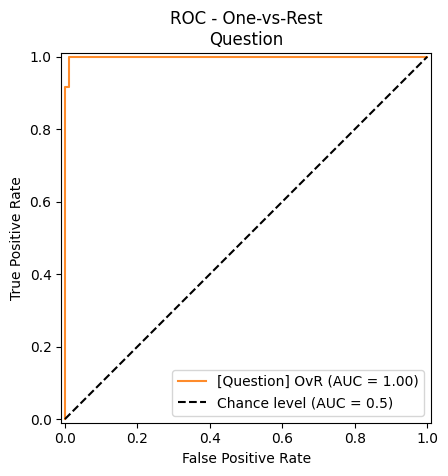
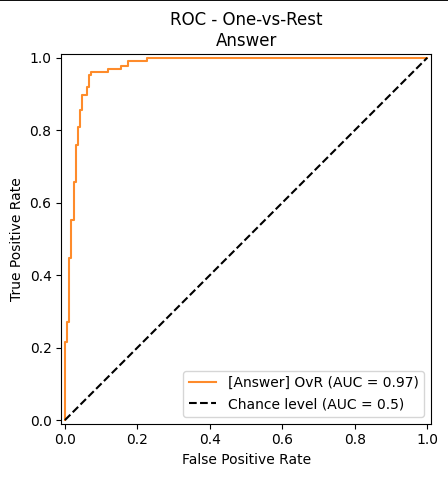
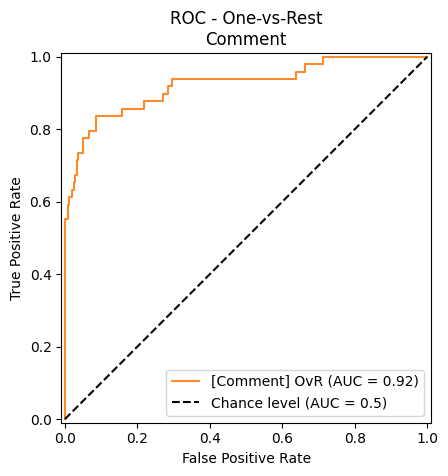
- ROC Curve: A ROC curve is a graphical representation of the model's performance on the test set. The model's performance is evaluated at different thresholds, and the ROC curve shows the trade-off between false positives and true positives.
- The ROC curve for the Question class shows a perfect classification with an AUC (Area Under the Curve) of 1.00. This means the model can distinguish between 'Question' and other classes without any false positives or negatives.
- The AUC of 0.97 for Answer classes demonstrates excellent model performance as well.
- With an AUC of 0.92 for Comment Class, it still indicates good performance but suggests that differenciating between comments from other types might be more challenging than questions and answers.
- Confusion Matrix: A confusion matrix provides a visual and numeric representation of the predictive accuracy and shows where the model is making mistakes.
- Out of 118 actual questions, 117 are correctly identified with only one misclassification as a comment.
- 116 out of 125 answers are correctly identified, but 8 are mistakenly identified as comments and one as a question.
- The model struggles relatively more with comments, correctly identifying 37 out of 49, with 10 misclassified as answers and 2 as questions.
Additionally, the model is saved as a Bentoml model for deployment.
- Tool Used: Scikit-learn, Matplotlib, Seaborn, Numpy
- Execution: currently done in the
model/create_model.ipynbnotebook.
The model is deployed using Bentoml, a framework for building and deploying machine learning models. The service employs a combination of BentoML, TensorFlow, and OpenAI's API to process, predict, and serve the results of text classifications via an API endpoint. Below are the API service components:
- Service Class: Defined as TensorFlowClassifierService using BentoML's service decorator to facilitate model serving.
- API Endpoint (
classify): A REST API endpoint that takes text input, processes it through the model, and returns classification results.
- Tool Used: Bentoml, TensorFlow, OpenAI
- Data Structure: Returns a JSON object containing the classification results.
- Execution: Code is in
deployment/bento_service.py
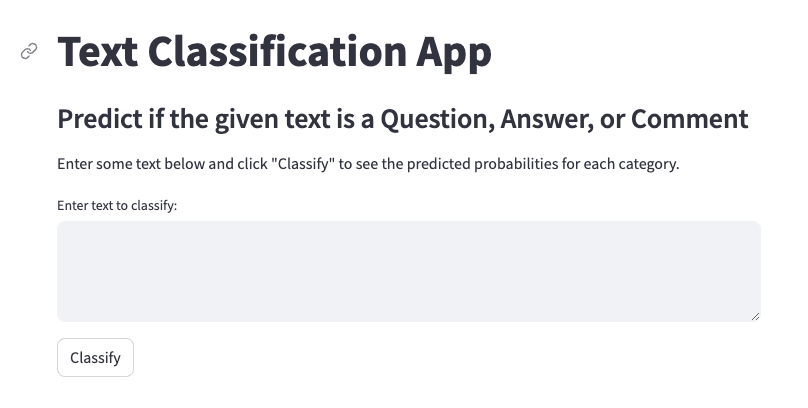
The Streamlit app is a user-friendly front-end interface that allows users to interact with the model and visualize the generated conversation data. The app provides a simple interface for users to input text and view the predicted probabilities for each category.
Upon clicking the "Classify" button, the app sends a POST request to the backend server with the input text. The server processes the text and returns the predicted probabilities for each category.
- Tool Used: Streamlit, Matplotlib, Seaborn, Numpy
- Execution: Run
frontend/streamlit_app.pyfile to launch the Streamlit app.
Thanks to all the contributors who have helped shape this project, and to Break Into Data for sponsoring the 30 Days ML Challenge.


