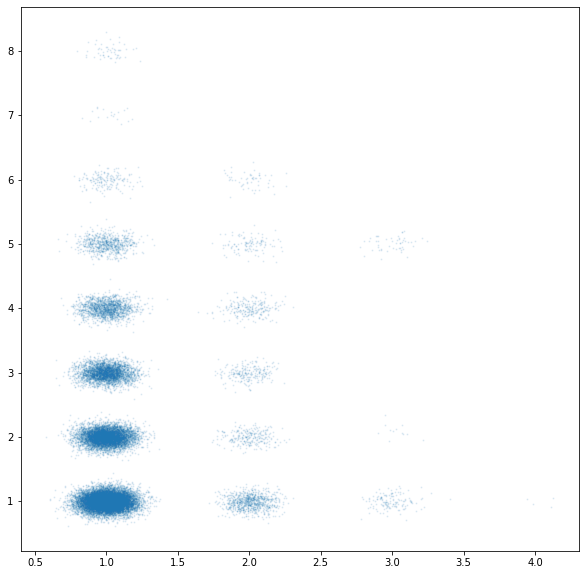
Explore NASA expoplanet archive; correlations between solar system planets and suns
Possible Objectives:
- Use a fisher's test to find the correlation between the number of stars and the number of planets in a solar system
- Complete a colineaity test between the mass and the temperature of the planet, and check if it adheres to theoretical ideals
- Discover how the size and distance of planets discovered planets changed over time. User a best-fit model to predict the average size and distance in 2030
Goals:
- Research theoretical models of covarience between the mass and temperature of a planet, select one
- Compare the colinearity test to the theoretical model, create a plot showing both the actual data and the theoretical model
- Discuss implications of the results, does the data support or contradict the theoretical model; what are the boundaries of the errors?
Hypothesis Selection:
The average temperature of binary star, 1 planet exoplanets is not statistically different from 1 planet exoplanets with a single star.
Conclustions:
Single sun, single planet exoplanets has a mean temperature of 920.4K Double sun, single planet exoplanets have a mean temperature of 1103.3K A Welche's T-Test demonstrated that these two sets ARE statistically different, and that a second sun is correlated with a higher mean planet temperature. The likely hood of this happening by chance is extermely small, with a p-value of 5.372188108099737e-07.


