This is a Tensorflow implementation of Potts models for Direct Coupling Analysis (DCA). Given a Multiple Sequence Alignment (MSA) for a protein, DCA is aimed to calculate the direct coupling between pairs of positions. It can be used to predict the contact map of proteins using MSA and the predicted contact map is useful for predicting protein 3D structures.
One effective method for DCA is using Potts models, which are also called Boltzmann machines in machine learning. Potts models belong to a larger category of models called generative probabilistic models, which means the model assigns a probablity for each sample and we can generate new samples by sampling from this distribution. The first step when using these generative probabilistic models is to learn a model from observed data. In the context of DCA, the observed data is a MSA and each sequence from the MSA is one sample. As the Potts model assign probabilities for all the samples, theretically, we can write the likelihood function of the data and use Maximum Likelihood Estimation (MLE) to learn the model. In practice, the MLE method does not work well because it requires calcualting or estimating the normalization constant of the model distribution. Several approximation methods have been developed to do the learning, such as Pseudo Maximum Likelihood Method, Score Matching, and Adaptive Cluter Expansion method among others.
In this implementation, the pseudo maximum likelihood method is used for learning the model. L-BFGS mehod is used for optimization and in the optimization, the weight matrix of the Potts model is restrainted to be symmetric. L2-normed penalty on the weight parameters is used for regulization.
The implementation here mainly follows the method presented in reference 1. I also list the reference 2 and 3, which introduced pseduo maximum likelihood method and average-product correction method, respectively.
- Ekeberg, Magnus, et al. "Improved contact prediction in proteins: using pseudolikelihoods to infer Potts models." Physical Review E 87.1 (2013): 012707.
- Besag, Julian. "Statistical analysis of non-lattice data." The statistician (1975): 179-195.
- Dunn, Stanley D., Lindi M. Wahl, and Gregory B. Gloor. "Mutual information without the influence of phylogeny or entropy dramatically improves residue contact prediction." Bioinformatics 24.3 (2007): 333-340.
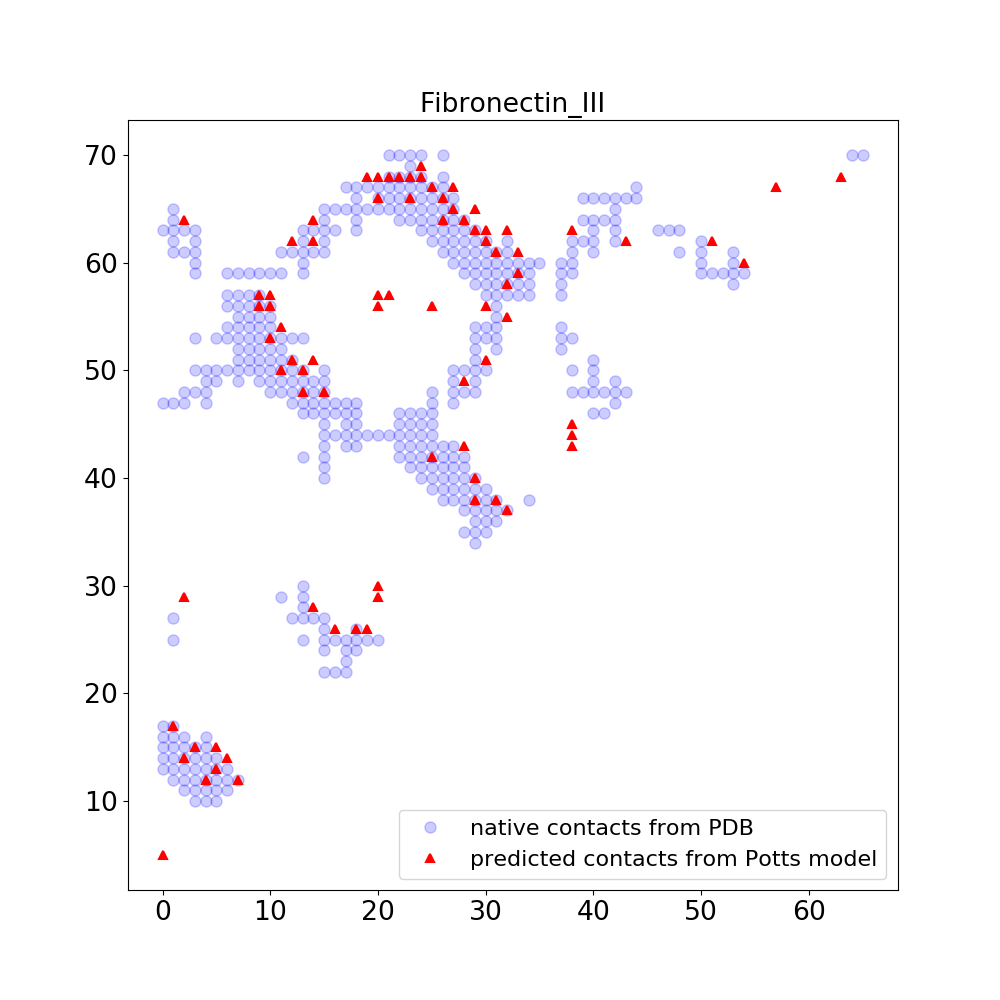
In this example, we first download a MSA from Pfam and use the MSA to train a Potts model. You can also use other method to make a MSA. Based on the trained Potts model, we calculate interaction scores between pairs of positions using average-product correction (AFC) method. At the end, we compare the pairs of postions with high interaction scores with native contact map obtained from a PDB structure.
-
Download a MSA from Pfam.
Given a Pfam ID (PF00041),
./script/download_MSA.pydownloads the corresponding multiple sequence alignment and saves it in the file./pfam_msa/PF00041_full.txtpython ./script/download_MSA.py PF00041 -
Process the MSA.
The downloaded MSA can not be used directly to train the Potts model. It has to be processed into a specific format using
./script/process_MSA.py. The queryTENA_HUMAN/804-884is used as the reference sequence to clean up the MSA. The results are saved in directory./pfam_msa/and they include filesseq_msa_binary.pkl, seq_msa.pkl, seq_pos_idx.pkl, seq_weights.pkl.python ./script/process_MSA.py ./pfam_msa/PF00041_full.txt TENA_HUMAN/804-884 ./pfam_msa/ -
Learn the Potts model.
Here we set the hyperparameters for learning the Potts model: 200 for maximum num of optimization steps and 0.05 for weight decay factor. The resulting Potss model is saved as
./model/model_weight_decay_0.050.pkl.python ./script/Potts_model.py ./pfam_msa/ 200 0.05 ./model/ -
Calculate and plot the interaction score.
python ./script/calc_score.py ./model/model_weight_decay_0.050.pkl 80Given the model
./model/model_weight_decay_0.050.pkl,./script/calc_score.pyis used to calculate the interaction scores between pairs of positions in the MSA. Based on the predicted interaction scores, the top 80 pairs of positions are predicted to have contacts and are plotted in the following figure. Also plotted in the following figure are the native contacts obtained from a PDB structure.