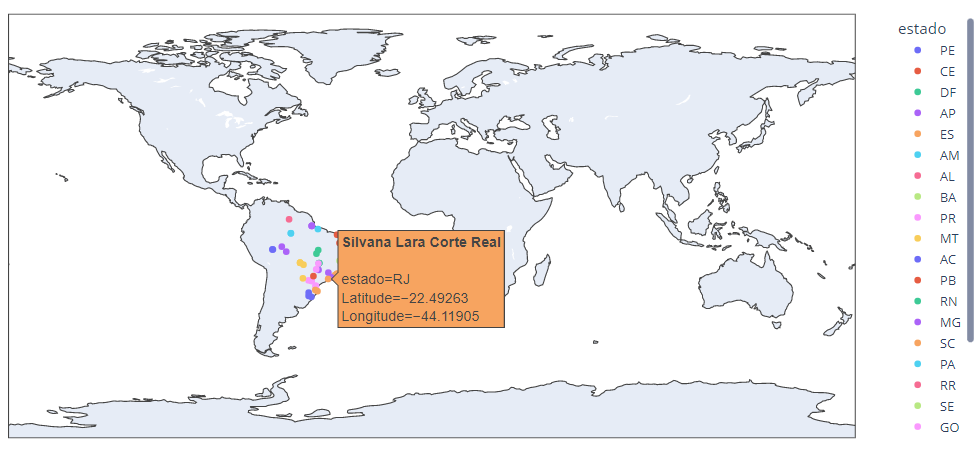
This code read a CVS file and return another one adding columns with geographic coordinates (Latitude and Longitude). Also there's a dinamic map ploted by plotly. Obs.: The dataset was obtainded by a fake data generator website.
Project status: ✔️ Concluded
🔹 Features
🔹 Author
Obtain geographic coordinates of people or companies descripted on a dataset. This code return Latitude and Longitude for each line of data, providing the visualization of them on a map. Here I used Plotly to show how to create a map on Python, but maybe it's more interesting to create on another softwer, like Power BI, that allows more creativity and possibility to create personalized tooltips.
- Because dataset contain adresses from Brazil, we treated the zip code (CEP) column to leave it in a standardized format (xxxxx-xxx);
- If the API can not find the geographic coordinates (because of a type error on a column for example), returns the string "Erro";
- This project calculate the time of execution. By experimentation, a unique requisition takes between 0.6 and 1.1 seconds, also depending on computation capacity. On a large dataset, this code can take a long time;
- It's possible to get the geographic coordinates of others countrys!
Librarys required in this project:
As example, take this screenshot of a map created under these codes:
Any doubts or ideas to develop this project you can contact me on email: bruno.canti.santos@gmail.com
