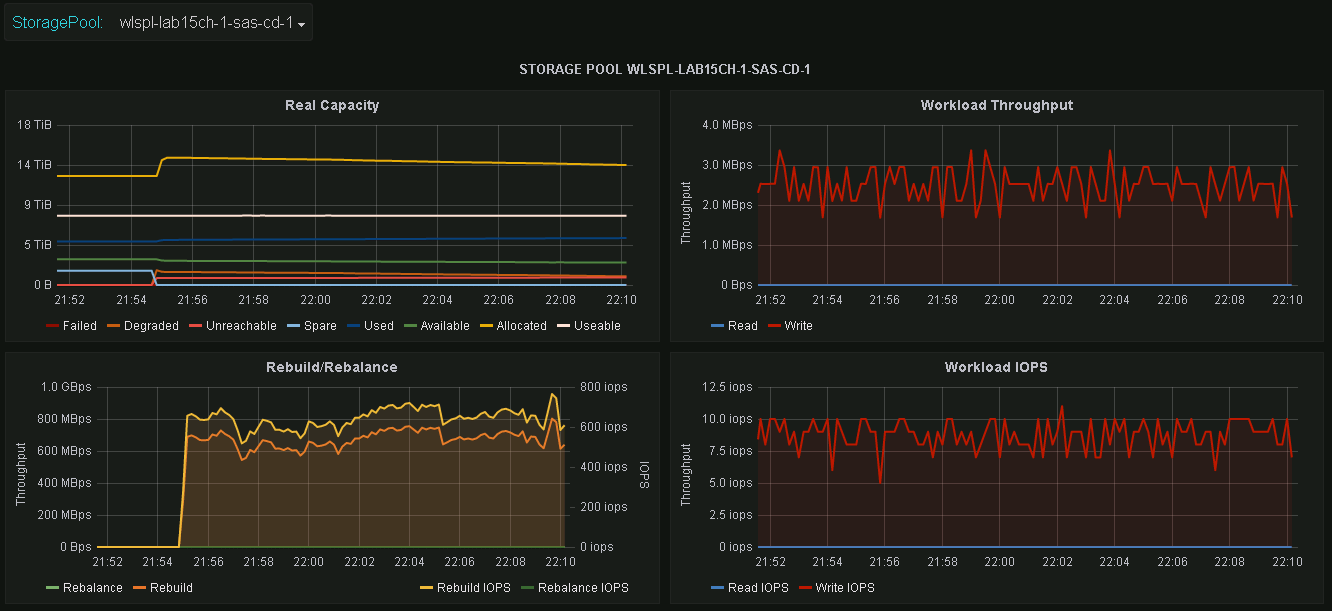
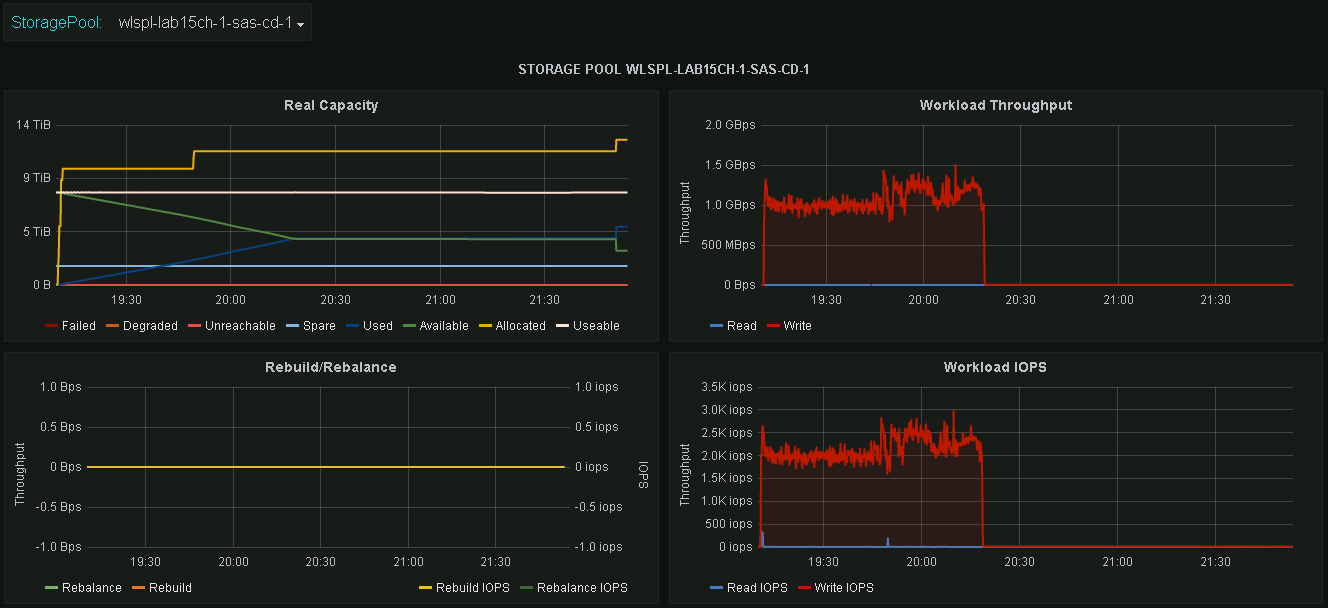
This is a collectd plugin to collect metrics of a ScaleIO cluster. It relies on ScaleIO REST-API to get metrics from the ScaleIO MDM cluster. A grafana dashboard that visualizes the metrics is available as well.
General requirements:
- The collectd plugin can be installed on a standalone linux installation that can connect to the ScaleIO gateway using HTTPS.
- This collectd plugin is written in Python and thus requires the collectd-python plugin and python-requests module to work correctly.
Copy the files manually from the plugin folder to the module path, ie:
cp plugin/scaleio.py /usr/share/collectd/pythonThe plugin needs to be configured in collectd as follows.
<LoadPlugin "python">
    Globals true
</LoadPlugin>
<Plugin "python">
    ModulePath "/usr/share/collectd/python"
    Import scaleio
    <Module scaleio>
        Debug true                        # default: false
        Verbose true                      # default: false
        Gateway "192.168.0.1:443"         # ScaleIO Gateway IP Address and listening port. (Mandatory)
        Cluster "myClusterNameToDisplay"  # Cluster name will be reported as the collectd hostname, default: myCluster
        Pools "poolA" "poolB"             # list of pools to be reported (Mandatory)
        MDMUser "admin"                   # ScaleIO MDM user for getting metrics (Mandatory)
        MDMPassword "adminpwd"            # Password of the ScaleIO MDM user (Mandatory)
    </Module>
</Plugin>
A grafana dashboard that visualizes the pool data can be found in the grafana directory.
The dashboard is ready to be installed, which can done by either packaging it (build_grafana_dashboard.sh) or by importing the dashboard manually.
Make sure to replace MY_DATASOURCE_NAME with the name of your grafana datasource that contains the collectd data, before importing/installing it.
sed -i 's/__dsname__/MY_DATASOURCE_NAME/g' grafana/dashboard.jsonThe plugin collects the following data
- Per storage pool (capacity is divided by 2, to have the 'real' values a user understands)
- raw bytes
- useable bytes
- available bytes
- allocated bytes
- unreachable unused bytes
- degraded bytes
- failed bytes
- spare bytes
- user read iops
- user read throughput
- user write iops
- user write throughput
- rebalance iops
- rebalance throughput
- rebuild iops
- rebuild throughput
See the LICENSE file for the project creator license rights and limitations (MIT).
See the CONTRIB_LICENSE for the license rights on the contributors portions of code (MIT).

